HOT TOPICS LIST
- MACD
- Fibonacci
- RSI
- Gann
- ADXR
- Stochastics
- Volume
- Triangles
- Futures
- Cycles
- Volatility
- ZIGZAG
- MESA
- Retracement
- Aroon
INDICATORS LIST
LIST OF TOPICS
PRINT THIS ARTICLE
by Kevin Hopson
The stock is consolidating between support and resistance, so which way will prices break?
Position: N/A
Kevin Hopson
Kevin has been a technical analyst for roughly 10 years now. Previously, Kevin owned his own business and acted as a registered investment advisor, specializing in energy. He was also a freelance oil analyst for Orient Trading Co., a commodity futures trading firm in Japan. Kevin is currently a freelance writer.
PRINT THIS ARTICLE
TECHNICAL ANALYSIS
A Tug of War For BHP Billiton
03/22/05 09:46:39 AMby Kevin Hopson
The stock is consolidating between support and resistance, so which way will prices break?
Position: N/A
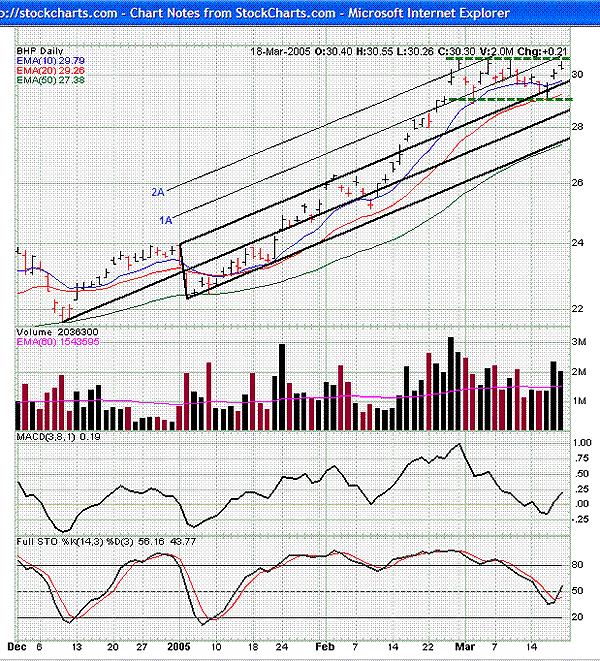
| BHP Billiton Ltd. (BHP) has been in a clear uptrend the last three months, but this bullishness, which has carried over to the options market, is also acting as resistance for the stock. For example, note how prices broke out of the black pitchfork configuration in mid-February 2005. When this occurred, it was an indication that the uptrend was strengthening. The stock initially found resistance along the 1A channel line but ultimately made its way up to the 2A channel line before pulling back. |
| As you can see, the stock has been consolidating in a potentially bullish trading range over the last few weeks, which is illustrated by the dotted green lines. The reason I say "bullish" is because trading ranges tend to act as continuation patterns and the move prior to this formation was up. In addition, note how prices recently bounced off the rising 20-day exponential moving average (EMA), as well as the top parallel line of the pitchfork. Because the stock continues to trade above its short-term moving averages and prices found support at prior resistance (top parallel line), the path of least resistance is higher. |

|
| Figure 1: BHP daily. BHP Billiton has been in a clear uptrend the last three months, but this bullishness, which has carried over to the options market, is also acting as resistance for the stock. |
| Graphic provided by: StockCharts.com. |
| |
| Unfortunately for long positions, there is a significant amount of call option open interest at the $30.00 strike price. More specifically, there are more than 9,700 call contracts outstanding at this strike price, making it the largest area of call open interest. This would not be as concerning if there was an equal amount of put option open interest at the $30.00 strike price. However, this is not the case, as put open interest equates to roughly 4,500 contracts. Because there is a substantial net call position (5,200 contracts) at the $30.00 strike price, there is more incentive to keep prices below $30.00 in the near term, as it benefits the sellers of these contracts. This is likely the reason why BHP Billiton has continued to find resistance above the $30.00 level. |
| However, if the stock breaks to the upside from its current trading range ($29.20-$30.80), it could spur panic buying by these call sellers (at least the naked call sellers). In other words, those call sellers who do not own the stock (naked) will likely buy shares in the open market to make sure prices do not get away from them. Otherwise, if the owners of these call contracts decide to exercise them, the sellers run the risk of having to buy at much higher prices. If the stock does break out, prices could eventually make their way up to the $34.00 to $35.60 range. For details on how to calculate price targets based on trading range breakouts, please refer to prior articles on the subject. |
Kevin has been a technical analyst for roughly 10 years now. Previously, Kevin owned his own business and acted as a registered investment advisor, specializing in energy. He was also a freelance oil analyst for Orient Trading Co., a commodity futures trading firm in Japan. Kevin is currently a freelance writer.
| Glen Allen, VA | |
| E-mail address: | hopson_1@yahoo.com |
Click here for more information about our publications!
Comments
Date: 03/23/05Rank: 3Comment:

Request Information From Our Sponsors
- StockCharts.com, Inc.
- Candle Patterns
- Candlestick Charting Explained
- Intermarket Technical Analysis
- John Murphy on Chart Analysis
- John Murphy's Chart Pattern Recognition
- John Murphy's Market Message
- MurphyExplainsMarketAnalysis-Intermarket Analysis
- MurphyExplainsMarketAnalysis-Visual Analysis
- StockCharts.com
- Technical Analysis of the Financial Markets
- The Visual Investor
- VectorVest, Inc.
- Executive Premier Workshop
- One-Day Options Course
- OptionsPro
- Retirement Income Workshop
- Sure-Fire Trading Systems (VectorVest, Inc.)
- Trading as a Business Workshop
- VectorVest 7 EOD
- VectorVest 7 RealTime/IntraDay
- VectorVest AutoTester
- VectorVest Educational Services
- VectorVest OnLine
- VectorVest Options Analyzer
- VectorVest ProGraphics v6.0
- VectorVest ProTrader 7
- VectorVest RealTime Derby Tool
- VectorVest Simulator
- VectorVest Variator
- VectorVest Watchdog
