HOT TOPICS LIST
- MACD
- Fibonacci
- RSI
- Gann
- ADXR
- Stochastics
- Volume
- Triangles
- Futures
- Cycles
- Volatility
- ZIGZAG
- MESA
- Retracement
- Aroon
INDICATORS LIST
LIST OF TOPICS
PRINT THIS ARTICLE
by Arthur Hill
After a period of indecision and consolidation, the iShares Software Index Fund appears to have made up its mind.
Position: Sell
Arthur Hill
Arthur Hill is currently editor of TDTrader.com, a website specializing in trading strategies, sector/industry specific breadth stats and overall technical analysis. He passed the Society of Technical Analysts (STA London) diploma exam with distinction is a Certified Financial Technician (CFTe). Prior to TD Trader, he was the Chief Technical Analyst for Stockcharts.com and the main contributor to the ChartSchool.
PRINT THIS ARTICLE
ON BALANCE VOLUME
Software Looking Soft
03/21/05 12:46:22 PMby Arthur Hill
After a period of indecision and consolidation, the iShares Software Index Fund appears to have made up its mind.
Position: Sell
| As its name implies, the Goldman Sachs iShares Software Index Fund (IGV) is an exchange-traded fund (ETF) made up of 47 software companies. The top six holdings make up around 48% of the fund and include Electronic Arts (ERTS), Oracle (ORCL), Microsoft (MSFT), Computer Associates (CA), Adobe Systems (ADBE), and Symantec (SYMC). It is plain to see that this fund is not going anywhere without help from these six. |
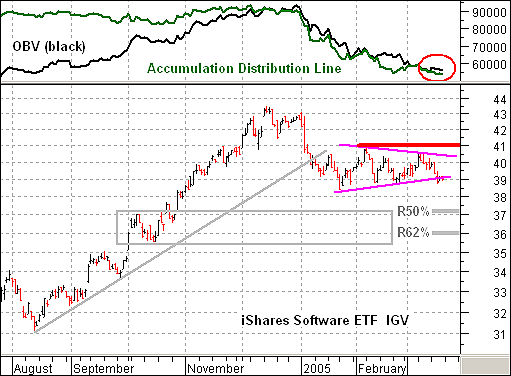
| On the price chart, IGV was one of the market leaders from August to December 2004 with a 38% gain from low to high. The stock declined with the rest of the market in January 2005 and then consolidated. During this consolidation, the Nasdaq traded flat, while the NYSE Composite moved to new highs. Both the Nasdaq and IGV underperformed over the last few weeks, and this is negative. |

|
| Figure 1: IGV. On the price chart, IGV was one of the market leaders from August to December 2004 with a 38% gain from low to high. The stock declined with the rest of the market in January 2005 and then consolidated. |
| Graphic provided by: MetaStock. |
| Graphic provided by: Reuters Data. |
| |
| The pattern over the last two months looks like a symmetrical triangle. After a decline, this pattern has a bearish bias and is usually just a resting point within the trend. A move below the lower trendline and February low (38.80) would signal a continuation lower and target further weakness to around 36-37, possibly lower. This initial target is found by measuring typical retracements and looking for prior consolidations. A 50-62% retracement of the prior advance would extend to 36-37 and there was small consolidation in this area in October (gray oval). |
| The stock is currently toying with trendline support, and key volume indicators suggest a break is more likely than not. The accumulation/distribution line and on-balance volume both peaked in December 2004 and have declined throughout 2005 as both indicators moved new lows this month. According to Granville, volume precedes price and this is a bearish omen. It would take a move above key resistance at 41 to negate this bearish prognosis. |
Arthur Hill is currently editor of TDTrader.com, a website specializing in trading strategies, sector/industry specific breadth stats and overall technical analysis. He passed the Society of Technical Analysts (STA London) diploma exam with distinction is a Certified Financial Technician (CFTe). Prior to TD Trader, he was the Chief Technical Analyst for Stockcharts.com and the main contributor to the ChartSchool.
| Title: | Editor |
| Company: | TDTrader.com |
| Address: | Willem Geetsstraat 17 |
| Mechelen, B2800 | |
| Phone # for sales: | 3215345465 |
| Website: | www.tdtrader.com |
| E-mail address: | arthurh@tdtrader.com |
Traders' Resource Links | |
| TDTrader.com has not added any product or service information to TRADERS' RESOURCE. | |
Click here for more information about our publications!
Comments
Date: 03/21/05Rank: 4Comment:

|

Request Information From Our Sponsors
- StockCharts.com, Inc.
- Candle Patterns
- Candlestick Charting Explained
- Intermarket Technical Analysis
- John Murphy on Chart Analysis
- John Murphy's Chart Pattern Recognition
- John Murphy's Market Message
- MurphyExplainsMarketAnalysis-Intermarket Analysis
- MurphyExplainsMarketAnalysis-Visual Analysis
- StockCharts.com
- Technical Analysis of the Financial Markets
- The Visual Investor
- VectorVest, Inc.
- Executive Premier Workshop
- One-Day Options Course
- OptionsPro
- Retirement Income Workshop
- Sure-Fire Trading Systems (VectorVest, Inc.)
- Trading as a Business Workshop
- VectorVest 7 EOD
- VectorVest 7 RealTime/IntraDay
- VectorVest AutoTester
- VectorVest Educational Services
- VectorVest OnLine
- VectorVest Options Analyzer
- VectorVest ProGraphics v6.0
- VectorVest ProTrader 7
- VectorVest RealTime Derby Tool
- VectorVest Simulator
- VectorVest Variator
- VectorVest Watchdog
