HOT TOPICS LIST
- MACD
- Fibonacci
- RSI
- Gann
- ADXR
- Stochastics
- Volume
- Triangles
- Futures
- Cycles
- Volatility
- ZIGZAG
- MESA
- Retracement
- Aroon
INDICATORS LIST
LIST OF TOPICS
PRINT THIS ARTICLE
by Gary Grosschadl
The roof caved in for Inspire in early February when the pharmaceutical company indicated that the FDA had rejected its drug Diquafosol.
Position: N/A
Gary Grosschadl
Independent Canadian equities trader and technical analyst based in Peterborough
Ontario, Canada.
PRINT THIS ARTICLE
CHART ANALYSIS
Inspire Is Seeking Inspiration
03/18/05 07:56:38 AMby Gary Grosschadl
The roof caved in for Inspire in early February when the pharmaceutical company indicated that the FDA had rejected its drug Diquafosol.
Position: N/A
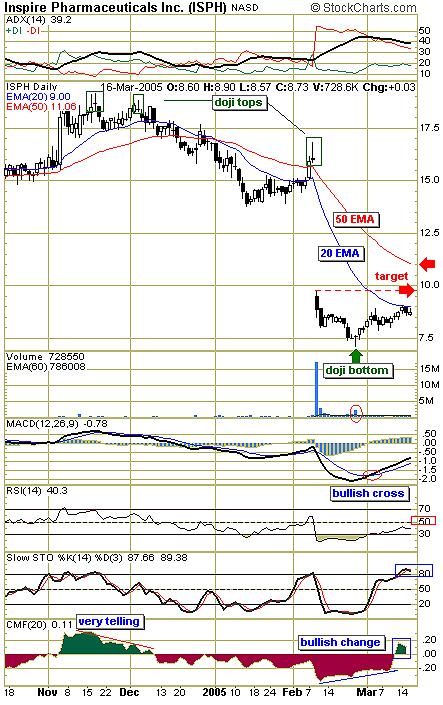
| The roof caved in for Inspire (ISPH) in early February 2005 when the pharmaceutical company indicated that the FDA had rejected its drug Diquafosol. Shares of Inspire fell dramatically in reaction to the news, shedding $7.12, or 44.5% to $8.88 per share on February 9. However, technical traders were given ample warning months before that. Note the doji tops coinciding with the telling negative divergences on the indicators below Figure 1. At this point, the smart money was vacating the play with impeccable timing. Dojis, with their telltale little crosses, often mark turning points after significant uplegs and downlegs. |
| It is often said that charts don't lie and a skilled tecnician need not read the news, as the chart speaks volumes. Although I don't cater to not investigating a stock as every trader should do their due diligence, I do at times marvel at how charts so often tip the hand of coming market action. |

|
| Figure 1: Inspire. The daily chart shows a doji bottom as this stock struggles against overhead resistance and a huge gap. |
| Graphic provided by: StockCharts.com. |
| |
| Despite this being a high-risk situation, those daunting higher-risk traders who waited for a good trading signal found this in the doji bottom (accompanied with a volume spike). Those bottom-chasing traders who risked that turnaround signal at ~$7.50 were no doubt well served if they waited for the first notable overhead test at the 20-day exponential moving average (EMA) of $9.50. |
| Notwithstanding that this is still a risk scenario, another short-term trading signal may be near for high-risk traders. This same 20-day EMA line marks the initial overhead resistance level that needs to be overcome before another possible thrust higher. A close above this current level of $9 will attract aggressive traders looking for the next overhead target. This chart suggests two such targets, the lower gap extreme of $9.75 and the more profitable level at or near $11 as marked by the 50-day EMA. |
| The displayed indicators are a mixed bag, reflecting the uncertainty of this situation. On the plus side is the high average directional movement index (ADX) pushing for directional movement index (DI) reversal. The DIs represent the stock's upward (bullish) and downward (bearish) movements. Should +DI move above -DI, the bulls have the upper hand. Other positive signs are the bullish cross shown on the moving average convergence/divergence (MACD)and the bullish change in the Chaikin money flow (CMF). Negative interpretations may be made of the relative strength index (RSI) being below the key 50 level and stochastics being in overbought territory. In summary, a high-risk short-term opportunity may present itself with the first close above the 20-day EMA. So do you bet on the chart or the lawyers pushing for the class-action lawsuit? I will watch with interest from the sidelines--it's much safer from there. |
Independent Canadian equities trader and technical analyst based in Peterborough
Ontario, Canada.
| Website: | www.whatsonsale.ca/financial.html |
| E-mail address: | gwg7@sympatico.ca |
Click here for more information about our publications!
Comments
Date: 03/19/05Rank: 4Comment:

Request Information From Our Sponsors
- VectorVest, Inc.
- Executive Premier Workshop
- One-Day Options Course
- OptionsPro
- Retirement Income Workshop
- Sure-Fire Trading Systems (VectorVest, Inc.)
- Trading as a Business Workshop
- VectorVest 7 EOD
- VectorVest 7 RealTime/IntraDay
- VectorVest AutoTester
- VectorVest Educational Services
- VectorVest OnLine
- VectorVest Options Analyzer
- VectorVest ProGraphics v6.0
- VectorVest ProTrader 7
- VectorVest RealTime Derby Tool
- VectorVest Simulator
- VectorVest Variator
- VectorVest Watchdog
- StockCharts.com, Inc.
- Candle Patterns
- Candlestick Charting Explained
- Intermarket Technical Analysis
- John Murphy on Chart Analysis
- John Murphy's Chart Pattern Recognition
- John Murphy's Market Message
- MurphyExplainsMarketAnalysis-Intermarket Analysis
- MurphyExplainsMarketAnalysis-Visual Analysis
- StockCharts.com
- Technical Analysis of the Financial Markets
- The Visual Investor
