

HOT TOPICS LIST
- MACD
- Fibonacci
- RSI
- Gann
- ADXR
- Stochastics
- Volume
- Triangles
- Futures
- Cycles
- Volatility
- ZIGZAG
- MESA
- Retracement
- Aroon
INDICATORS LIST
LIST OF TOPICS
PRINT THIS ARTICLE
by Sean Moore
The linear regression trendline and linear regression channel can help identify market trends as well as areas of support and resistance.
Position: N/A
Sean Moore
Traders.com Staff Writer.
PRINT THIS ARTICLE
LIN. REGTREND
What's The Best-Fit?
06/16/00 04:47:00 PMby Sean Moore
The linear regression trendline and linear regression channel can help identify market trends as well as areas of support and resistance.
Position: N/A
| Linear regression is often used in the statistical analysis of research data, and can be used to find trendlines in securities. Linear regression uses sets of data points which it plots on a graph as x and y-variables. The linear regression line is then calculated as a straight line and goes through the average of those points. This is called a best-fit line. You can apply linear regression to stock market prices by using the closing price and the time as the x and y-coordinates. The resulting linear regression -best-fit- line would be your trendline. The advantage to using a statistical model to plot your trendline is that you get a mathematically accurate trendline, placing half the data above the best-fit line and half beneath. Many current software packages, including Microsoft Excel have the linear regression line as a built-in indicator. The indicator eliminates the tedious calculations behind the linear regression technique and helps to make it a more usable tool. |
| Different regression lines can be drawn for different time periods of interest. A long-term trader may be interested in the trend over the last several months, while the short-term trader may only be interested in the last few days or weeks. |
|
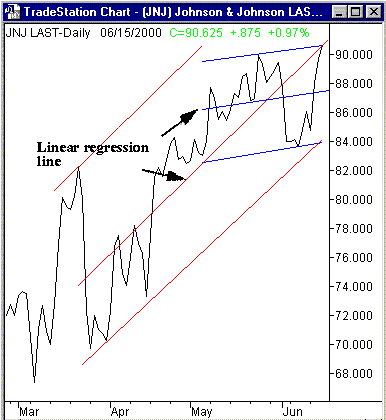
| Figure 1: Closing prices for Johnson & Johnson plotted with two linear regression channels, one for the last 30 days (blue) and one for the last 60 days (red). |
| Graphic provided by: TradeStation. |
| |
| The regression line represents a median for the price. As the price travels farther above or below this line, the likelihood of the price returning to the regression line becomes greater and greater. Thus, the indicator can be used for showing when changes in price direction are likely to occur. Another use of the indicator is with regression channels, where support and resistance lines are drawn parallel to the best-fit line. Pick the point with the greatest distance above the best-fit line for your resistance line, and pick the point with the greatest distance below the best-fit line for your support line. Buy and sell positions should be considered when the price approaches these lines of support and resistance. |
| The chart in Figure 1 plots the closing prices for Johnson & Johnson [JNJ] and shows two linear regression channels. The shorter channel in blue is based on the previous 30 days of data, while the longer channel in red is based on the previous 60 days of closing price data. In each case, the middle line represents the linear regression line, the upper parallel line is the resistance line, and the lower parallel line is the support line. The two different channels give two different perspectives. A short-term trader would be inclined to pay attention to the shorter time period, while the long-term trader would focus more on the extended time period. As of the close on 6/15/2000, the short-term trend indicates a potential sell as the price hits the upper resistance line. For the longer term trend, however, the price is right in the middle of the channel, so a hold position would be satisfied. |
| With the use of linear regression lines, you can add a different twist to determining trends and identifying areas of support and resistance. By drawing lines with different lengths of time, you can customize the indicator for your specific trading needs. |
Traders.com Staff Writer.
| Title: | Project Engineer |
| Company: | Technical Analysis, Inc. |
| Address: | 4757 California Ave. SW |
| Seattle, WA 98116 | |
| Phone # for sales: | 206 938 0570 |
| Fax: | 206 938 1307 |
| Website: | Traders.com |
| E-mail address: | smoore@traders.com |
Traders' Resource Links | |
| Charting the Stock Market: The Wyckoff Method -- Books | |
| Working-Money.com -- Online Trading Services | |
| Traders.com Advantage -- Online Trading Services | |
| Technical Analysis of Stocks & Commodities -- Publications and Newsletters | |
| Working Money, at Working-Money.com -- Publications and Newsletters | |
| Traders.com Advantage -- Publications and Newsletters | |
| Professional Traders Starter Kit -- Software | |
Click here for more information about our publications!
Comments
Date:�/ /Rank:�2Comment:�
Date:�/ /Rank:�2Comment:�

Request Information From Our Sponsors
- StockCharts.com, Inc.
- Candle Patterns
- Candlestick Charting Explained
- Intermarket Technical Analysis
- John Murphy on Chart Analysis
- John Murphy's Chart Pattern Recognition
- John Murphy's Market Message
- MurphyExplainsMarketAnalysis-Intermarket Analysis
- MurphyExplainsMarketAnalysis-Visual Analysis
- StockCharts.com
- Technical Analysis of the Financial Markets
- The Visual Investor
- VectorVest, Inc.
- Executive Premier Workshop
- One-Day Options Course
- OptionsPro
- Retirement Income Workshop
- Sure-Fire Trading Systems (VectorVest, Inc.)
- Trading as a Business Workshop
- VectorVest 7 EOD
- VectorVest 7 RealTime/IntraDay
- VectorVest AutoTester
- VectorVest Educational Services
- VectorVest OnLine
- VectorVest Options Analyzer
- VectorVest ProGraphics v6.0
- VectorVest ProTrader 7
- VectorVest RealTime Derby Tool
- VectorVest Simulator
- VectorVest Variator
- VectorVest Watchdog