HOT TOPICS LIST
- MACD
- Fibonacci
- RSI
- Gann
- ADXR
- Stochastics
- Volume
- Triangles
- Futures
- Cycles
- Volatility
- ZIGZAG
- MESA
- Retracement
- Aroon
INDICATORS LIST
LIST OF TOPICS
PRINT THIS ARTICLE
by Gary Grosschadl
The insurance index shows a bearish pattern and a downside move beginning.
Position: Sell
Gary Grosschadl
Independent Canadian equities trader and technical analyst based in Peterborough
Ontario, Canada.
PRINT THIS ARTICLE
WEDGE FORMATIONS
Insurance Index Risky
03/18/05 07:45:02 AMby Gary Grosschadl
The insurance index shows a bearish pattern and a downside move beginning.
Position: Sell
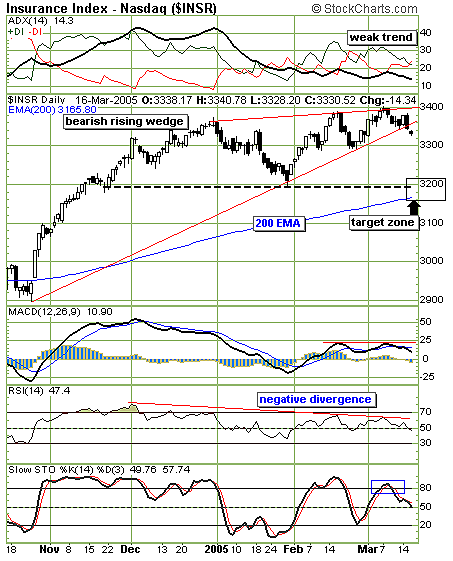
| Rising wedges are a bearish pattern and always depict an obvious upward slope. Figure 1, the daily chart of the insurance index, shows this bearish pattern clearly and a possible breakdown beginning as the last trading session gaps down below the lower trendline. These wedges typically are reversal patterns although they can also be continuation patterns. |
| A downside target range is chosen based on previous support and a significant moving average line. The area just below 3200 held support on two previous occasions and this area is likely to test support again. What makes this area even more significant is the proximity to the ever-important 200-day moving average (in this case, the exponential moving average [EMA]). Wedges, as opposed to symmetrical triangles, do not have a pattern fulfillment measure, so the 200-day EMA is a likely support target. |

|
| Figure 1: Daily chart of the Insurance Index shows a bearish pattern. A possible breakdown is beginning as the last trading session gaps down below the lower trendline. |
| Graphic provided by: StockCharts.com. |
| |
| Several indicators are worthy of mention. At the top of the chart, the average directional movement index (ADX) shows a weak trend since the ADX fell below 20, so these challenges of the previous high in 2004 were fraught with doubt. The moving average convergence/divergence (MACD) and the relative strength index (RSI) both show a negative divergence to the overall direction of this index. This is often an excellent clue that a correction of some sort is pending. Meanwhile, the stochastic oscillator has aleady embarked on a downleg from the 80 region. |
| A surprise move above 3400 or the top trendline negates the wedge's bearish implication. In the meantime, expect a minor test just below 3300, failure of which will lead to a stonger support test of the 3200 target zone. |
Independent Canadian equities trader and technical analyst based in Peterborough
Ontario, Canada.
| Website: | www.whatsonsale.ca/financial.html |
| E-mail address: | gwg7@sympatico.ca |
Click here for more information about our publications!
Comments
Date: 03/19/05Rank: 5Comment:

Request Information From Our Sponsors
- StockCharts.com, Inc.
- Candle Patterns
- Candlestick Charting Explained
- Intermarket Technical Analysis
- John Murphy on Chart Analysis
- John Murphy's Chart Pattern Recognition
- John Murphy's Market Message
- MurphyExplainsMarketAnalysis-Intermarket Analysis
- MurphyExplainsMarketAnalysis-Visual Analysis
- StockCharts.com
- Technical Analysis of the Financial Markets
- The Visual Investor
- VectorVest, Inc.
- Executive Premier Workshop
- One-Day Options Course
- OptionsPro
- Retirement Income Workshop
- Sure-Fire Trading Systems (VectorVest, Inc.)
- Trading as a Business Workshop
- VectorVest 7 EOD
- VectorVest 7 RealTime/IntraDay
- VectorVest AutoTester
- VectorVest Educational Services
- VectorVest OnLine
- VectorVest Options Analyzer
- VectorVest ProGraphics v6.0
- VectorVest ProTrader 7
- VectorVest RealTime Derby Tool
- VectorVest Simulator
- VectorVest Variator
- VectorVest Watchdog
