HOT TOPICS LIST
- MACD
- Fibonacci
- RSI
- Gann
- ADXR
- Stochastics
- Volume
- Triangles
- Futures
- Cycles
- Volatility
- ZIGZAG
- MESA
- Retracement
- Aroon
INDICATORS LIST
LIST OF TOPICS
PRINT THIS ARTICLE
by David Penn
Relatively unconvinced by the 2B top displayed on the daily S&P 500 chart? Try a weekly chart on for size.
Position: N/A
David Penn
Technical Writer for Technical Analysis of STOCKS & COMMODITIES magazine, Working-Money.com, and Traders.com Advantage.
PRINT THIS ARTICLE
REVERSAL
The S&P's Weekly 2B
03/17/05 08:01:20 AMby David Penn
Relatively unconvinced by the 2B top displayed on the daily S&P 500 chart? Try a weekly chart on for size.
Position: N/A
| Whenever I hear a top trader or technical analyst refer to a setup or pattern that I feel I have an excellent grasp of, I always feel a tinge of anxiety. Either I'm going to find myself in agreement with the Master Trader or Technical Analyst--elevating both of us in my own estimation--or we're going to be at odds. And, as often as not, that sucks. As a contrarian interviewee in Jack Schwager's MARKET WIZARDS once quipped of other Market Wizards, "Who wants to be on the other side of guys like that?" |
| Fortunately, I've managed to find an accommodation with a recent article by Alan Farley, whose renown as a technical analyst in general and a sharp-shooting swing trader, in specific, are second to none. Farley, writing for TheStreet.com, referred recently to a trading setup I have written about regularly for the past few years--that setup being Victor Sperandeo's 2B top. |

|
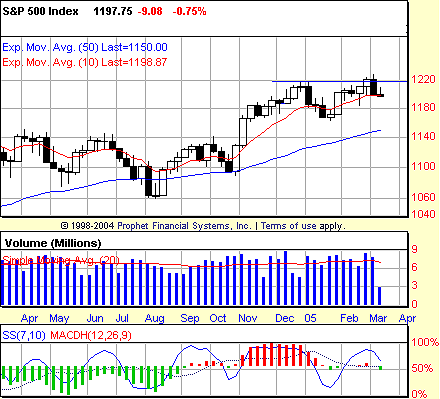
| Figure 1: S&P 500. 2B or not 2B on the weekly? This weekly chart of the S&P 500 does a better job than the daily chart of showing the 2B top between the December 2004 and February 2005 highs. |
| Graphic provided by: Prophet Financial, Inc. |
| |
| The 2B top--or Turtle Soup, as Larry Connors refers to a very similar setup in his book, STREET SMARTS (co-authored with Linda Bradford Raschke)--is one of the many gems in Sperandeo's pair of books, METHODS OF A WALL STREET MASTER and PRINCIPLES OF PROFESSIONAL SPECULATION. Deceptively simple, the 2B top simply states that when a market makes a new high, but reverses instead of following through, there is a sizable chance that a reversal is in the offing. The odds for a reversal can be strengthened when other technical indicators are used--Japanese candlesticks, stochastic divergences, chart patterns, and so forth. But in and of itself, the 2B top (or its opposite, the 2B bottom) can be a powerful pattern auguring often major reversals. |
| Farley saw a 2B top in the daily chart of the Standard & Poor's 500. I shied away from that call because, to my eye, there was at least one day of followthrough to the upside after the breakout. We can quibble over what constitutes "followthrough" and what does not. I want there to be NO followthrough whatsoever--as in a down day or down bar/candlestick immediately after the breakout day or bar/candlestick. For me, when that happens, there is no unnecessary additional analysis: there was a new high, the market then reversed, start probing short opportunities, end of discussion. |
| And that is exactly what you get when you consider the weekly chart of the S&P 500 instead of the daily chart. Note in Figure 1 how there is a breakout during the last week of February/first week of March, then a reversal back below the breakout area during the second week of March. That's a 2B top, without any qualification. Sperandeo's take on the 2B top calls for taking a position against the uptrend below the low of the initial high. In this case, that would mean going short below the low of the last week of December 2004, or at about 1204-1205. The market fell to this level on March 10. Thus, as far as "Trader Vic" is concerned, 2B top traders looking to go short should already have their game on. |
Technical Writer for Technical Analysis of STOCKS & COMMODITIES magazine, Working-Money.com, and Traders.com Advantage.
| Title: | Technical Writer |
| Company: | Technical Analysis, Inc. |
| Address: | 4757 California Avenue SW |
| Seattle, WA 98116 | |
| Phone # for sales: | 206 938 0570 |
| Fax: | 206 938 1307 |
| Website: | www.Traders.com |
| E-mail address: | DPenn@traders.com |
Traders' Resource Links | |
| Charting the Stock Market: The Wyckoff Method -- Books | |
| Working-Money.com -- Online Trading Services | |
| Traders.com Advantage -- Online Trading Services | |
| Technical Analysis of Stocks & Commodities -- Publications and Newsletters | |
| Working Money, at Working-Money.com -- Publications and Newsletters | |
| Traders.com Advantage -- Publications and Newsletters | |
| Professional Traders Starter Kit -- Software | |
Click here for more information about our publications!
Comments
Date: 03/19/05Rank: 3Comment:
Date: 03/21/05Rank: 5Comment:

Request Information From Our Sponsors
- VectorVest, Inc.
- Executive Premier Workshop
- One-Day Options Course
- OptionsPro
- Retirement Income Workshop
- Sure-Fire Trading Systems (VectorVest, Inc.)
- Trading as a Business Workshop
- VectorVest 7 EOD
- VectorVest 7 RealTime/IntraDay
- VectorVest AutoTester
- VectorVest Educational Services
- VectorVest OnLine
- VectorVest Options Analyzer
- VectorVest ProGraphics v6.0
- VectorVest ProTrader 7
- VectorVest RealTime Derby Tool
- VectorVest Simulator
- VectorVest Variator
- VectorVest Watchdog
- StockCharts.com, Inc.
- Candle Patterns
- Candlestick Charting Explained
- Intermarket Technical Analysis
- John Murphy on Chart Analysis
- John Murphy's Chart Pattern Recognition
- John Murphy's Market Message
- MurphyExplainsMarketAnalysis-Intermarket Analysis
- MurphyExplainsMarketAnalysis-Visual Analysis
- StockCharts.com
- Technical Analysis of the Financial Markets
- The Visual Investor
