HOT TOPICS LIST
- MACD
- Fibonacci
- RSI
- Gann
- ADXR
- Stochastics
- Volume
- Triangles
- Futures
- Cycles
- Volatility
- ZIGZAG
- MESA
- Retracement
- Aroon
INDICATORS LIST
LIST OF TOPICS
PRINT THIS ARTICLE
by Arthur Hill
Caterpillar has been a top performer over the last two and a half years, but a large negative divergence in RSI could signal the beginning of the end.
Position: Hold
Arthur Hill
Arthur Hill is currently editor of TDTrader.com, a website specializing in trading strategies, sector/industry specific breadth stats and overall technical analysis. He passed the Society of Technical Analysts (STA London) diploma exam with distinction is a Certified Financial Technician (CFTe). Prior to TD Trader, he was the Chief Technical Analyst for Stockcharts.com and the main contributor to the ChartSchool.
PRINT THIS ARTICLE
REL. STR OSCILL
RSI Divergence Looms Large For Caterpillar
03/16/05 07:59:10 AMby Arthur Hill
Caterpillar has been a top performer over the last two and a half years, but a large negative divergence in RSI could signal the beginning of the end.
Position: Hold
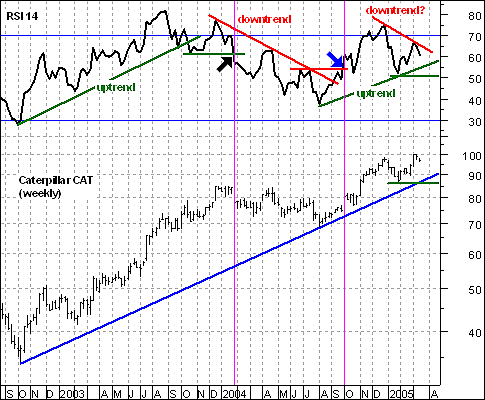
| Caterpillar has been a top performer over the last two and a half years, but a large negative divergence in the relative strength index (RSI) could signal the beginning of the end. There are a number of ways to use RSI. Readings above 70 can signal that a stock is overbought and readings below 30 can signal that a stock is oversold. These overbought and oversold levels can be further enhanced with positive or negative divergences. In addition, these divergences can be used to confirm or refute a recent move. |
| RSI can also be used to confirm the trend and foreshadow trend reversals. As Figure 1 shows, RSI trends as well as oscillates. The indicator oscillates between zero and 100, but the movements within these upper and lower bands can often develop into a multimonth trend. The green trendlines show a clear uptrend with higher highs and higher lows. A downtrend begins when the indicator breaks below the trendline and the prior low (black arrow). The downtrend is denoted by lower lows and lower highs (red lines). The downtrend ends with a break above the upper trendline and the prior high (blue arrow). |

|
| Figure 1: Caterpillar. As you can see, RSI trends as well as oscillates. The green trendlines show a clear uptrend with higher highs and higher lows. A downtrend begins when the indicator breaks below the trendline and the prior low (black arrow). The downtrend is denoted by lower lows and lower highs (red lines). The downtrend ends with a break above the upper trendline and the prior high (blue arrow). |
| Graphic provided by: MetaStock. |
| Graphic provided by: Reuters. |
| |
| For CAT, the RSI remains in an uptrend, but a negative divergence looms and further weakness below the January low would usher in a downtrend. Note that the stock moved to a new high in early March, but RSI failed to confirm with a higher high. Instead, RSI formed a lower high below 70, and this shows waning upside momentum. |
| The price chart confirms the current situation with RSI. The stock remains in an uptrend as long as the blue trendline and January low hold (86.4). After all, the stock is forging ahead with higher highs and higher lows. A move below 86.4 would break the trendline and forge a lower low, thus changing the trend from bullish to bearish. The first downside target would be support around 70. |
Arthur Hill is currently editor of TDTrader.com, a website specializing in trading strategies, sector/industry specific breadth stats and overall technical analysis. He passed the Society of Technical Analysts (STA London) diploma exam with distinction is a Certified Financial Technician (CFTe). Prior to TD Trader, he was the Chief Technical Analyst for Stockcharts.com and the main contributor to the ChartSchool.
| Title: | Editor |
| Company: | TDTrader.com |
| Address: | Willem Geetsstraat 17 |
| Mechelen, B2800 | |
| Phone # for sales: | 3215345465 |
| Website: | www.tdtrader.com |
| E-mail address: | arthurh@tdtrader.com |
Traders' Resource Links | |
| TDTrader.com has not added any product or service information to TRADERS' RESOURCE. | |
Click here for more information about our publications!
Comments
Date: 03/16/05Rank: 4Comment:
Date: 07/03/06Rank: 4Comment:

|

Request Information From Our Sponsors
- StockCharts.com, Inc.
- Candle Patterns
- Candlestick Charting Explained
- Intermarket Technical Analysis
- John Murphy on Chart Analysis
- John Murphy's Chart Pattern Recognition
- John Murphy's Market Message
- MurphyExplainsMarketAnalysis-Intermarket Analysis
- MurphyExplainsMarketAnalysis-Visual Analysis
- StockCharts.com
- Technical Analysis of the Financial Markets
- The Visual Investor
- VectorVest, Inc.
- Executive Premier Workshop
- One-Day Options Course
- OptionsPro
- Retirement Income Workshop
- Sure-Fire Trading Systems (VectorVest, Inc.)
- Trading as a Business Workshop
- VectorVest 7 EOD
- VectorVest 7 RealTime/IntraDay
- VectorVest AutoTester
- VectorVest Educational Services
- VectorVest OnLine
- VectorVest Options Analyzer
- VectorVest ProGraphics v6.0
- VectorVest ProTrader 7
- VectorVest RealTime Derby Tool
- VectorVest Simulator
- VectorVest Variator
- VectorVest Watchdog
