HOT TOPICS LIST
- MACD
- Fibonacci
- RSI
- Gann
- ADXR
- Stochastics
- Volume
- Triangles
- Futures
- Cycles
- Volatility
- ZIGZAG
- MESA
- Retracement
- Aroon
INDICATORS LIST
LIST OF TOPICS
PRINT THIS ARTICLE
by Koos van der Merwe
For some time now, I have been suggesting that the market could start turning down, moving into a new bear market that will last two to three years.
Position: Sell
Koos van der Merwe
Has been a technical analyst since 1969, and has worked as a futures and options trader with First Financial Futures in Johannesburg, South Africa.
PRINT THIS ARTICLE
ELLIOTT WAVE
Is The Market Poised For A Turndown?
03/11/05 01:49:19 PMby Koos van der Merwe
For some time now, I have been suggesting that the market could start turning down, moving into a new bear market that will last two to three years.
Position: Sell
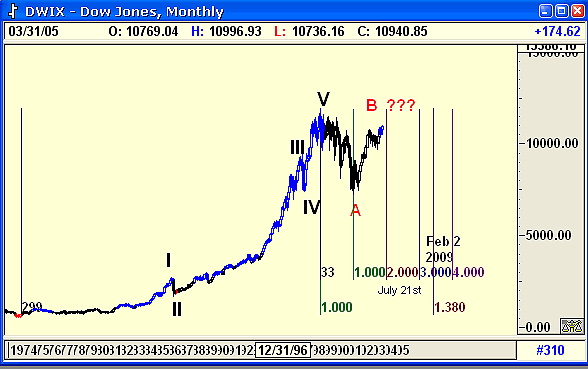
| My long-term projection based on Elliott wave theory suggests that the current rise could be a B-wave that could turn into a devastating C-wave, one that will make the market bubble burst of 2000 seem like a birthday party. Let us look at the evidence. |
 Figure 1: Long-term monthly chart, Dow Jones Industrial Average Figure 1 is my long-term monthly chart of the Dow Jones Industrial Average (DJIA). It is showing that we are near the end of what could be wave B upward, with wave C to follow. That is what should happen, with wave C bottoming in February 2009. This is the expected cycle, because an ABC retracement to a bull market rise is usually 38.2% (a Fibonacci ratio) of the previous five-impulse wave upward. In Figure 1, I have shown that the bull market started in 1974. In the whole picture, this is wave V in the overall Grand Cycle of the bull market run from the end of the Great Depression. Many Elliott wave theorists believe that the top of wave V in 2000 was the top of the long-term wave. If this is so, then the low in February 2009 will only be the end of wave A, of an even larger wave ABC correction, that will bottom sometime in the year 2020. |

|
| Figure 2: DJIA monthly |
| Graphic provided by: AdvancedGET. |
| |
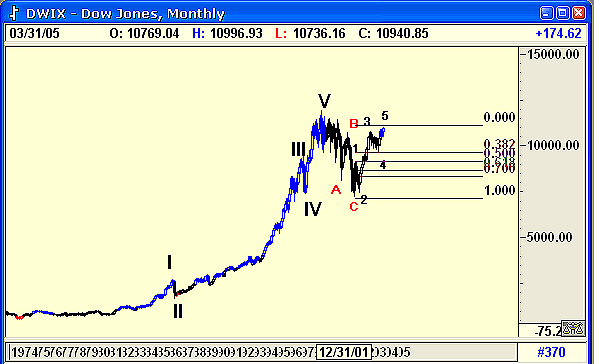
| For this forecast, however, I prefer to look at a far shorter term, and this in turn leads to the question marks shown. The query is there because in all my years of charting, I have never seen a B-wave move in a five-wave impulse pattern. Usually, it rises in an a-b-c-x-a-b-c pattern. This makes me ask whether the wave A shown should not be wave C and that the rise is a new wave 1 of a five-impulse wave pattern upward. If so, it means that the market is now in a major long-term bull market and that a correction down is now due. Wave 1 usually leads to a wave 2 correction that is a 72% retracement or more of the length of wave 1. This means that whatever the pattern really is, for the immediate short term, we can expect a sizable correction in the very near future. It is just the depth of that correction and the time for the low that is questionable. Figure 2 suggests the various Fibonacci levels the DJIA could fall to. |
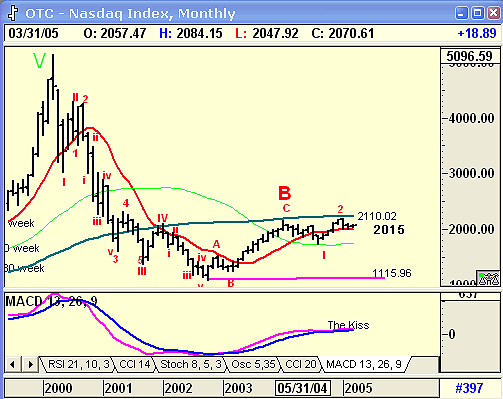
| There is no doubt that a correction should occur in the near future. Gann turning point charts are suggesting the top of the market could occur on March 7, with the first correction of wave 2 down bottoming on March 17. The thrust oscillator is also calling for a correction down, as are other charts. Figure 3 is the Nasdaq monthly chart, which is following the expected pattern:  |
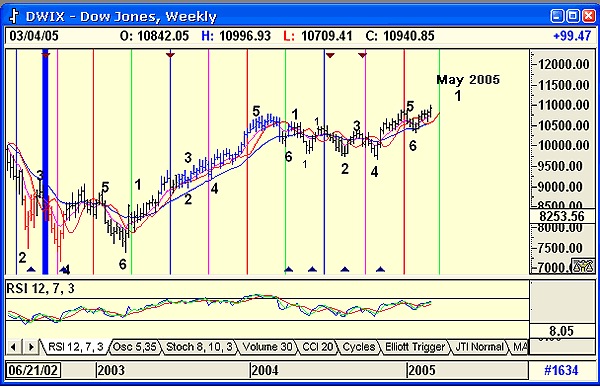
| Note how the index appears to have completed waves 1 and 2 of expected wave C down. Note how the index is finding support and resistance levels at the 40- and 80-week moving averages. In addition, note "The Kiss," where the moving average convergence/divergence (MACD) indicator is suggesting that a strong sell signal could soon be in the offing if and when the maroon line breaks below the blue line. Caution prevails in how we should read the market direction for the coming months. We know that the market will correct. What we do not know is WHEN the market will correct. Here I turn to a cyclical chart based on patterns of previous turning points:  Figure 4: DJIA, weekly Figure 4 is a weekly chart with cyclical turning points based on the phases of the moon. Note the remarkable pattern that formed for cyclical turning points. (I have a larger chart for those interested in learning more.) The chart is calling for a top at the end of April, or the beginning of May 2005. The maxim "Sell in May and go away" comes to mind. If you think I am scared of the market ... yes, I am, but it can be traded, as long as you do not believe in the buy and hold strategy. The end of April/beginning of May are the dates to watch, depending on your risk tolerance. |
Has been a technical analyst since 1969, and has worked as a futures and options trader with First Financial Futures in Johannesburg, South Africa.
| Address: | 3256 West 24th Ave |
| Vancouver, BC | |
| Phone # for sales: | 6042634214 |
| E-mail address: | petroosp@gmail.com |
Click here for more information about our publications!
Comments
Date: 03/12/05Rank: 4Comment:
Date: 03/15/05Rank: 4Comment:
Date: 03/15/05Rank: 3Comment:
Date: 03/15/05Rank: 5Comment:
Date: 04/03/05Rank: 5Comment:

Request Information From Our Sponsors
- StockCharts.com, Inc.
- Candle Patterns
- Candlestick Charting Explained
- Intermarket Technical Analysis
- John Murphy on Chart Analysis
- John Murphy's Chart Pattern Recognition
- John Murphy's Market Message
- MurphyExplainsMarketAnalysis-Intermarket Analysis
- MurphyExplainsMarketAnalysis-Visual Analysis
- StockCharts.com
- Technical Analysis of the Financial Markets
- The Visual Investor
- VectorVest, Inc.
- Executive Premier Workshop
- One-Day Options Course
- OptionsPro
- Retirement Income Workshop
- Sure-Fire Trading Systems (VectorVest, Inc.)
- Trading as a Business Workshop
- VectorVest 7 EOD
- VectorVest 7 RealTime/IntraDay
- VectorVest AutoTester
- VectorVest Educational Services
- VectorVest OnLine
- VectorVest Options Analyzer
- VectorVest ProGraphics v6.0
- VectorVest ProTrader 7
- VectorVest RealTime Derby Tool
- VectorVest Simulator
- VectorVest Variator
- VectorVest Watchdog
