HOT TOPICS LIST
- MACD
- Fibonacci
- RSI
- Gann
- ADXR
- Stochastics
- Volume
- Triangles
- Futures
- Cycles
- Volatility
- ZIGZAG
- MESA
- Retracement
- Aroon
INDICATORS LIST
LIST OF TOPICS
PRINT THIS ARTICLE
by David Penn
The failure to hold above the upper boundary of the old trend channel suggests a new channel--and a test of a new lower boundary.
Position: N/A
David Penn
Technical Writer for Technical Analysis of STOCKS & COMMODITIES magazine, Working-Money.com, and Traders.com Advantage.
PRINT THIS ARTICLE
CHANNEL LINES
The S&P 500's Spring Channel Surfing
03/11/05 08:12:49 AMby David Penn
The failure to hold above the upper boundary of the old trend channel suggests a new channel--and a test of a new lower boundary.
Position: N/A
| Channeling is one of the more commonly used tools in charting the markets. A colleague here in the office (a colleague who had a very successful February, by the way) first turned me on to trend channels a few years back, and it has been interesting to see how many applications trend channels have in technical analysis. Whether it is as part of an Andrews pitchfork or Elliott wave structure, trend channels have proven their value in a variety of ways. |
| I wrote a few months ago about how a market can travel in one trend channel, break out above it, and then use the upper boundary of the old trend channel as the lower boundary of the new trend. That discussion might have suggested in part that if a market that broke out of a trend channel fell back into it, then substantial weakness was likely to follow. However, the example of the Standard & Poor's 500 since the August 2004 lows may be instructive. |

|
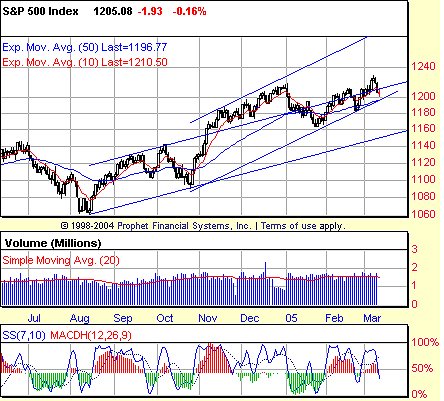
| Figure 1: S&P 500. As one channel dies, another channel struggles to be born. Here, the higher lows in January, February, and March (so far) work to provide support for a new trend channel with the October lows as its origin. |
| Graphic provided by: Prophet Financial, Inc. |
| |
| The bull market swing in the S&P 500 began in August 2004. In November 2004, the S&P 500 broke out above the three-month trend channel and, for two months, used the upper resistance boundary of the earlier, three-month channel as support. This ended in mid-January 2005, however, as the S&P 500 broke down beneath that support and reentered the old channel. |
| While this was certainly bearish on a short-term perspective, the fact that prices never fell back to the lower boundary of the old trend channel is significant for at least two reasons. First, such a correction would have validated the old trend channel. It would have been easy then to suspect that the breakout in November and December 2004 represented an unsustainable move and, potentially, insurmountable highs. Second, a correction that tested the lower boundary of the old trend channel would have likely also taken out potential support at the 1140 level--throwing into question the entire move from the August lows. |
| Instead, by establishing a set of lower lows in January, February, and March to date, the S&P 500 has managed to recreate a new trend channel, one with several tests of the upside boundary back in November and December and several tests of the lower boundary in the first few months of 2005. Should the S&P 500 find support at the lower boundary of this developing trend channel (which would also likely involve finding support at the 50-day exponential moving average), then there would be a strong chance that the S&P 500 would move back up toward a test of the upper boundary, likely setting a new high for the year in the process. |
Technical Writer for Technical Analysis of STOCKS & COMMODITIES magazine, Working-Money.com, and Traders.com Advantage.
| Title: | Technical Writer |
| Company: | Technical Analysis, Inc. |
| Address: | 4757 California Avenue SW |
| Seattle, WA 98116 | |
| Phone # for sales: | 206 938 0570 |
| Fax: | 206 938 1307 |
| Website: | www.Traders.com |
| E-mail address: | DPenn@traders.com |
Traders' Resource Links | |
| Charting the Stock Market: The Wyckoff Method -- Books | |
| Working-Money.com -- Online Trading Services | |
| Traders.com Advantage -- Online Trading Services | |
| Technical Analysis of Stocks & Commodities -- Publications and Newsletters | |
| Working Money, at Working-Money.com -- Publications and Newsletters | |
| Traders.com Advantage -- Publications and Newsletters | |
| Professional Traders Starter Kit -- Software | |
Click here for more information about our publications!
Comments
Date: 03/12/05Rank: 4Comment:
Date: 03/15/05Rank: 4Comment:
Date: 03/16/05Rank: 5Comment:

Request Information From Our Sponsors
- StockCharts.com, Inc.
- Candle Patterns
- Candlestick Charting Explained
- Intermarket Technical Analysis
- John Murphy on Chart Analysis
- John Murphy's Chart Pattern Recognition
- John Murphy's Market Message
- MurphyExplainsMarketAnalysis-Intermarket Analysis
- MurphyExplainsMarketAnalysis-Visual Analysis
- StockCharts.com
- Technical Analysis of the Financial Markets
- The Visual Investor
- VectorVest, Inc.
- Executive Premier Workshop
- One-Day Options Course
- OptionsPro
- Retirement Income Workshop
- Sure-Fire Trading Systems (VectorVest, Inc.)
- Trading as a Business Workshop
- VectorVest 7 EOD
- VectorVest 7 RealTime/IntraDay
- VectorVest AutoTester
- VectorVest Educational Services
- VectorVest OnLine
- VectorVest Options Analyzer
- VectorVest ProGraphics v6.0
- VectorVest ProTrader 7
- VectorVest RealTime Derby Tool
- VectorVest Simulator
- VectorVest Variator
- VectorVest Watchdog
