HOT TOPICS LIST
- MACD
- Fibonacci
- RSI
- Gann
- ADXR
- Stochastics
- Volume
- Triangles
- Futures
- Cycles
- Volatility
- ZIGZAG
- MESA
- Retracement
- Aroon
INDICATORS LIST
LIST OF TOPICS
PRINT THIS ARTICLE
by Arthur Hill
After a big run in 2004, Mitsubishi Tokyo Financial consolidated for several months and looks poised to continue higher.
Position: Accumulate
Arthur Hill
Arthur Hill is currently editor of TDTrader.com, a website specializing in trading strategies, sector/industry specific breadth stats and overall technical analysis. He passed the Society of Technical Analysts (STA London) diploma exam with distinction is a Certified Financial Technician (CFTe). Prior to TD Trader, he was the Chief Technical Analyst for Stockcharts.com and the main contributor to the ChartSchool.
PRINT THIS ARTICLE
ASCENDING TRIANGLES
Mitsubishi Tokyo Financial Forms Bullish Continuation Pattern
03/11/05 09:08:22 AMby Arthur Hill
After a big run in 2004, Mitsubishi Tokyo Financial consolidated for several months and looks poised to continue higher.
Position: Accumulate
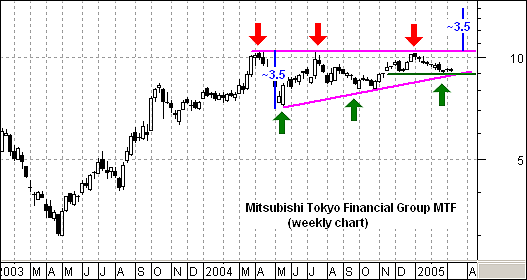
| The current pattern at work for Mitsubishi Tokyo Financial (MTF) is an ascending triangle. These are bullish continuation patterns that occur after an advance and foreshadow a continuation of that advance. As with most patterns, some sort of confirmation is required, and this comes in the form of a resistance breakout. |
| The pattern reflects both increasing demand and overhead supply. The green arrows show a series of higher lows. These higher lows formed because buyers came in at higher prices and prevented prices from moving below the prior low. This shows increasing demand. |

|
| Figure 1: Mitsubishi Tokyo Financial. The pattern reflects both increasing demand and overhead supply. The green arrows show a series of higher lows. Even though demand is increasing, there is overhead supply around 10.5 (red arrows). |
| Graphic provided by: MetaStock. |
| Graphic provided by: Reuters Data. |
| |
| Resistance marks overhead supply. Even though demand is increasing, there is overhead supply around 10.5 (red arrows). The stock tried to punch through this resistance level and failed each time. A move through 10.5 would signal a victory over supply and argue for further strength. |
| The upside target would be to around 14. The length of the pattern is added to the breakout for a projection (~10.5 - ~7 = 3.5, 10.5 + 3.5 = 14). The stock is currently trading near support and needs to hold the lower trendline to keep the pattern alive. A move below this trendline and the December low would negate the pattern and the bullish forecast. |
Arthur Hill is currently editor of TDTrader.com, a website specializing in trading strategies, sector/industry specific breadth stats and overall technical analysis. He passed the Society of Technical Analysts (STA London) diploma exam with distinction is a Certified Financial Technician (CFTe). Prior to TD Trader, he was the Chief Technical Analyst for Stockcharts.com and the main contributor to the ChartSchool.
| Title: | Editor |
| Company: | TDTrader.com |
| Address: | Willem Geetsstraat 17 |
| Mechelen, B2800 | |
| Phone # for sales: | 3215345465 |
| Website: | www.tdtrader.com |
| E-mail address: | arthurh@tdtrader.com |
Traders' Resource Links | |
| TDTrader.com has not added any product or service information to TRADERS' RESOURCE. | |
Click here for more information about our publications!
Comments
Date: 03/12/05Rank: 4Comment:
Date: 03/16/05Rank: 3Comment:

Request Information From Our Sponsors
- VectorVest, Inc.
- Executive Premier Workshop
- One-Day Options Course
- OptionsPro
- Retirement Income Workshop
- Sure-Fire Trading Systems (VectorVest, Inc.)
- Trading as a Business Workshop
- VectorVest 7 EOD
- VectorVest 7 RealTime/IntraDay
- VectorVest AutoTester
- VectorVest Educational Services
- VectorVest OnLine
- VectorVest Options Analyzer
- VectorVest ProGraphics v6.0
- VectorVest ProTrader 7
- VectorVest RealTime Derby Tool
- VectorVest Simulator
- VectorVest Variator
- VectorVest Watchdog
- StockCharts.com, Inc.
- Candle Patterns
- Candlestick Charting Explained
- Intermarket Technical Analysis
- John Murphy on Chart Analysis
- John Murphy's Chart Pattern Recognition
- John Murphy's Market Message
- MurphyExplainsMarketAnalysis-Intermarket Analysis
- MurphyExplainsMarketAnalysis-Visual Analysis
- StockCharts.com
- Technical Analysis of the Financial Markets
- The Visual Investor
