HOT TOPICS LIST
- MACD
- Fibonacci
- RSI
- Gann
- ADXR
- Stochastics
- Volume
- Triangles
- Futures
- Cycles
- Volatility
- ZIGZAG
- MESA
- Retracement
- Aroon
INDICATORS LIST
LIST OF TOPICS
PRINT THIS ARTICLE
by Gary Grosschadl
Crude oil again spikes high--is it peaking?
Position: Hold
Gary Grosschadl
Independent Canadian equities trader and technical analyst based in Peterborough
Ontario, Canada.
PRINT THIS ARTICLE
Which Way For Oil?
03/10/05 02:08:02 PMby Gary Grosschadl
Crude oil again spikes high--is it peaking?
Position: Hold
| In October 2004, oil spiked to $55 and then corrected all the way down to near $40. Now five months later, it has spiked to $55 again. Where does it go from here? |
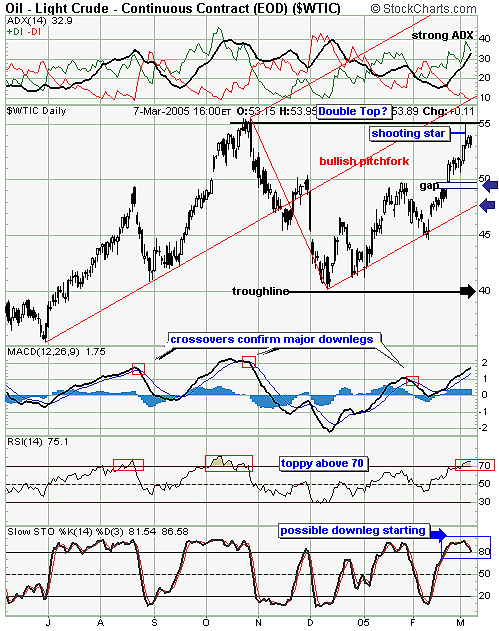
| To explore both upside and downside possibilities, we can draw an Andrews pitchfork. This method of showing possible support and resistance levels is based on choosing three major turning points at ~ $35, $55, and $40. The software then plots the parallel bisecting lines. |

|
| Figure 1: Downside implications in an otherwise bullish pitchfork. |
| Graphic provided by: StockCharts.com. |
| |
| What this bullish pitchfork shows is a climb higher between the median line (center) and the lower median line. As long as this lower line holds support, the uptrend remains intact. In theory, there can be an eventual thrust to meet the median line before the pattern reverses course to test the lower again. Should this occur, the spike north could be in the $60 region. |
| The chart also shows a recent shooting star candlestick that warns of a possible top, suggesting that a thrust to the median will be thwarted. A move above the top of the shooting star would negate this bearish implication. Until that happens, the likely scenario is that a lower test will occur. Two areas are suggested, being the gap area of $49-50 and the lower median line of ~ $48. Another possibility is that this could be a double top formation that would could lead to an eventual troughline test to $40. |
| Several indicators also depict bullish and bearish possibilities. The average directional movement index (ADX) and the moving average convergence/divergence (MACD) both show a powerful upward move still in play. However, the relative strength index (RSI) and the stochastics oscillator remind us that conditions are indeed toppy. My view is that the shooting star rules for now and a failure to move above it has downside implications. |
Independent Canadian equities trader and technical analyst based in Peterborough
Ontario, Canada.
| Website: | www.whatsonsale.ca/financial.html |
| E-mail address: | gwg7@sympatico.ca |
Click here for more information about our publications!
Comments
Date: 03/10/05Rank: 5Comment:
Date: 03/15/05Rank: 4Comment:
Date: 03/15/05Rank: 4Comment:

Request Information From Our Sponsors
- StockCharts.com, Inc.
- Candle Patterns
- Candlestick Charting Explained
- Intermarket Technical Analysis
- John Murphy on Chart Analysis
- John Murphy's Chart Pattern Recognition
- John Murphy's Market Message
- MurphyExplainsMarketAnalysis-Intermarket Analysis
- MurphyExplainsMarketAnalysis-Visual Analysis
- StockCharts.com
- Technical Analysis of the Financial Markets
- The Visual Investor
- VectorVest, Inc.
- Executive Premier Workshop
- One-Day Options Course
- OptionsPro
- Retirement Income Workshop
- Sure-Fire Trading Systems (VectorVest, Inc.)
- Trading as a Business Workshop
- VectorVest 7 EOD
- VectorVest 7 RealTime/IntraDay
- VectorVest AutoTester
- VectorVest Educational Services
- VectorVest OnLine
- VectorVest Options Analyzer
- VectorVest ProGraphics v6.0
- VectorVest ProTrader 7
- VectorVest RealTime Derby Tool
- VectorVest Simulator
- VectorVest Variator
- VectorVest Watchdog
