HOT TOPICS LIST
- MACD
- Fibonacci
- RSI
- Gann
- ADXR
- Stochastics
- Volume
- Triangles
- Futures
- Cycles
- Volatility
- ZIGZAG
- MESA
- Retracement
- Aroon
INDICATORS LIST
LIST OF TOPICS
PRINT THIS ARTICLE
by David Penn
While the Dow and S&P 500 soar toward new highs, the Nasdaq continues to lag behind.
Position: N/A
David Penn
Technical Writer for Technical Analysis of STOCKS & COMMODITIES magazine, Working-Money.com, and Traders.com Advantage.
PRINT THIS ARTICLE
RETRACEMENT
The Nasdaq's 50% Solution
03/10/05 11:03:29 AMby David Penn
While the Dow and S&P 500 soar toward new highs, the Nasdaq continues to lag behind.
Position: N/A
| It's worth saying this much at the outset: on the one hand, we have the Dow Jones Industrial Average (DJIA) setting a new high for the year, and getting some observers thinking that new ALL-TIME highs might not be too far away (a la 1972). |
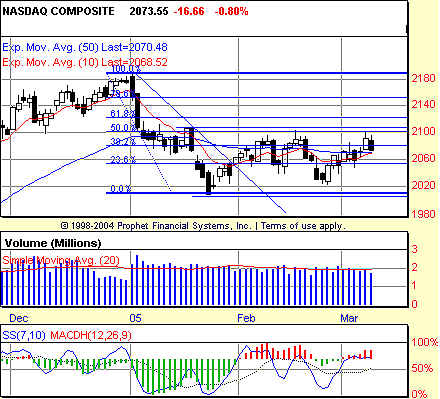
| And on the other hand, we have the Nasdaq composite--which is struggling to get above the 50% retracement level from its January 2005 correction. (See Figure 1.) |

|
| Figure 1: What could have been a rally to recoup January losses turned into a sideways consolidation as the Nasdaq met stiff resistance at the 50% retracement level. |
| Graphic provided by: Prophet Financial, Inc. |
| |
| There is a temptation to state the obvious--and a temptation to avoid stating the obvious. I'll succumb to the former: It is hard to imagine stocks in general continuing to move higher as long as the Nasdaq is unable to retrace more than 50% of its previous decline. The 50% retracement level is perhaps the king of retracement levels. This level is among those highlighted by traders using Fibonacci retracements, and also appears as a component of Dow theory when trying to determine the significance of countertrend market moves. Here's noted Dow theorist Richard Russell talking about what he calls the "50% principle": |
| "I gleaned the 50% Principle from the great Dow Theorist, George Schaefer. Schaefer stated that he dug up the 50% Principle from his study of Dow's writing. At any rate, what a major average does ... at the 50% or halfway level of a major advance or decline is critically important. Example--on a decline it's important to note whether the Dow halts above the halfway level of the preceding advance. If, on a decline, the Dow can retain 50% of the ground gained on the preceding advance--that's a bullish situation, and often leads to a test of the highs again. "On the other hand, if the decline wipes out more than half of the preceding advance, that's a bearish situation and the Dow will usually go a good deal lower." |
| By this criterion, the Nasdaq's post-January bounce has not been very encouraging for the bulls. True, the January decline may or may not qualify as a "major decline," shaving as it did 8% off the late December/early January highs. But the fact that the Nasdaq has repeatedly failed to break above its 50% retracement level suggests that the level is worth watching in any event. In this regard, the table is set for Nasdaq traders. If the Nasdaq makes it above its 50% retracement level, then the benefit of the doubt will certainly have to be given the bulls for thinking that a retest of the 2180 might follow shortly thereafter. However, if the Nasdaq continues to fail at the 50% retracement level, then it is hard not to believe that a test of the January lows south of 2020 will be in store. |
Technical Writer for Technical Analysis of STOCKS & COMMODITIES magazine, Working-Money.com, and Traders.com Advantage.
| Title: | Technical Writer |
| Company: | Technical Analysis, Inc. |
| Address: | 4757 California Avenue SW |
| Seattle, WA 98116 | |
| Phone # for sales: | 206 938 0570 |
| Fax: | 206 938 1307 |
| Website: | www.Traders.com |
| E-mail address: | DPenn@traders.com |
Traders' Resource Links | |
| Charting the Stock Market: The Wyckoff Method -- Books | |
| Working-Money.com -- Online Trading Services | |
| Traders.com Advantage -- Online Trading Services | |
| Technical Analysis of Stocks & Commodities -- Publications and Newsletters | |
| Working Money, at Working-Money.com -- Publications and Newsletters | |
| Traders.com Advantage -- Publications and Newsletters | |
| Professional Traders Starter Kit -- Software | |
Click here for more information about our publications!
Comments
Date: 03/10/05Rank: 4Comment:
Date: 03/15/05Rank: 5Comment:
Date: 03/15/05Rank: 4Comment:

Request Information From Our Sponsors
- StockCharts.com, Inc.
- Candle Patterns
- Candlestick Charting Explained
- Intermarket Technical Analysis
- John Murphy on Chart Analysis
- John Murphy's Chart Pattern Recognition
- John Murphy's Market Message
- MurphyExplainsMarketAnalysis-Intermarket Analysis
- MurphyExplainsMarketAnalysis-Visual Analysis
- StockCharts.com
- Technical Analysis of the Financial Markets
- The Visual Investor
- VectorVest, Inc.
- Executive Premier Workshop
- One-Day Options Course
- OptionsPro
- Retirement Income Workshop
- Sure-Fire Trading Systems (VectorVest, Inc.)
- Trading as a Business Workshop
- VectorVest 7 EOD
- VectorVest 7 RealTime/IntraDay
- VectorVest AutoTester
- VectorVest Educational Services
- VectorVest OnLine
- VectorVest Options Analyzer
- VectorVest ProGraphics v6.0
- VectorVest ProTrader 7
- VectorVest RealTime Derby Tool
- VectorVest Simulator
- VectorVest Variator
- VectorVest Watchdog
