HOT TOPICS LIST
- MACD
- Fibonacci
- RSI
- Gann
- ADXR
- Stochastics
- Volume
- Triangles
- Futures
- Cycles
- Volatility
- ZIGZAG
- MESA
- Retracement
- Aroon
INDICATORS LIST
LIST OF TOPICS
PRINT THIS ARTICLE
by Arthur Hill
QualComm (QCOM) broke double-top support with a big gap, and this broken support area has now turned into resistance.
Position: Sell
Arthur Hill
Arthur Hill is currently editor of TDTrader.com, a website specializing in trading strategies, sector/industry specific breadth stats and overall technical analysis. He passed the Society of Technical Analysts (STA London) diploma exam with distinction is a Certified Financial Technician (CFTe). Prior to TD Trader, he was the Chief Technical Analyst for Stockcharts.com and the main contributor to the ChartSchool.
PRINT THIS ARTICLE
DOUBLE TOPS
QualComm Returns To The Scene Of The Crime
03/09/05 08:11:48 AMby Arthur Hill
QualComm (QCOM) broke double-top support with a big gap, and this broken support area has now turned into resistance.
Position: Sell
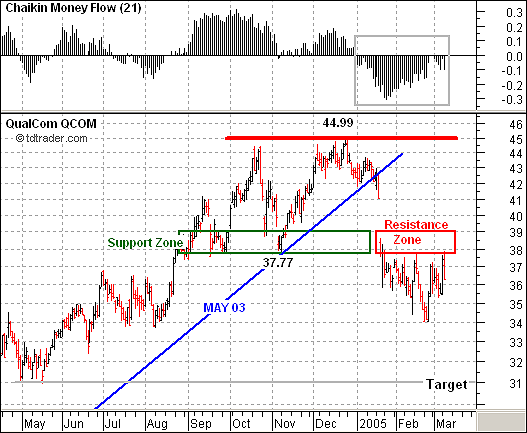
| In my late December 2004 article on QualComm, I highlighted a number of bearish candlestick reversals and these bore fruit with a gap down and support break at 37.77. The bigger pattern at work is a double top, and the convincing support break confirms this pattern. The downside target is around 31 and this is found by subtracting the height of the pattern from the support break (~45 - ~38 = 7; 38 - 7 = 31). |
| The stock has consolidated since breaking support, and broken support turned into resistance. This is a classic tenet of technical analysis and often offers a second chance to sell or establish a short position. Note that there was a support zone (green box), and now there is a resistance zone (red box) at the same level. The stock failed at this resistance zone twice in February and looks poised to fail again in March. See Figure 1. |

|
| Figure 1: QCOM. The stock failed at a resistance zone twice in February and looks poised to fail again in March. |
| Graphic provided by: MetaStock. |
| Graphic provided by: Reuters Data. |
| |
| QualComm needs to break above this resistance zone and start showing some positive money flow to get back on the bullish track. The February reaction highs confirm resistance and it would take a move above 39 to enter the gap zone and start showing some strength. In addition, note that 21-day Chaikin money flow has been in negative territory the entire year. This suggests that distribution is occurring within the consolidation. The indicator has improved somewhat with the recent move to -10%, but it would need to move above zero to show actual buying pressure. |
Arthur Hill is currently editor of TDTrader.com, a website specializing in trading strategies, sector/industry specific breadth stats and overall technical analysis. He passed the Society of Technical Analysts (STA London) diploma exam with distinction is a Certified Financial Technician (CFTe). Prior to TD Trader, he was the Chief Technical Analyst for Stockcharts.com and the main contributor to the ChartSchool.
| Title: | Editor |
| Company: | TDTrader.com |
| Address: | Willem Geetsstraat 17 |
| Mechelen, B2800 | |
| Phone # for sales: | 3215345465 |
| Website: | www.tdtrader.com |
| E-mail address: | arthurh@tdtrader.com |
Traders' Resource Links | |
| TDTrader.com has not added any product or service information to TRADERS' RESOURCE. | |
Click here for more information about our publications!
Comments
Date: 03/09/05Rank: 3Comment:

Request Information From Our Sponsors
- StockCharts.com, Inc.
- Candle Patterns
- Candlestick Charting Explained
- Intermarket Technical Analysis
- John Murphy on Chart Analysis
- John Murphy's Chart Pattern Recognition
- John Murphy's Market Message
- MurphyExplainsMarketAnalysis-Intermarket Analysis
- MurphyExplainsMarketAnalysis-Visual Analysis
- StockCharts.com
- Technical Analysis of the Financial Markets
- The Visual Investor
- VectorVest, Inc.
- Executive Premier Workshop
- One-Day Options Course
- OptionsPro
- Retirement Income Workshop
- Sure-Fire Trading Systems (VectorVest, Inc.)
- Trading as a Business Workshop
- VectorVest 7 EOD
- VectorVest 7 RealTime/IntraDay
- VectorVest AutoTester
- VectorVest Educational Services
- VectorVest OnLine
- VectorVest Options Analyzer
- VectorVest ProGraphics v6.0
- VectorVest ProTrader 7
- VectorVest RealTime Derby Tool
- VectorVest Simulator
- VectorVest Variator
- VectorVest Watchdog
