HOT TOPICS LIST
- MACD
- Fibonacci
- RSI
- Gann
- ADXR
- Stochastics
- Volume
- Triangles
- Futures
- Cycles
- Volatility
- ZIGZAG
- MESA
- Retracement
- Aroon
INDICATORS LIST
LIST OF TOPICS
PRINT THIS ARTICLE
by Arthur Hill
SBC Corp. has been trending lower over the last several months, and the relative strength index has reached an important resistance level.
Position: Sell
Arthur Hill
Arthur Hill is currently editor of TDTrader.com, a website specializing in trading strategies, sector/industry specific breadth stats and overall technical analysis. He passed the Society of Technical Analysts (STA London) diploma exam with distinction is a Certified Financial Technician (CFTe). Prior to TD Trader, he was the Chief Technical Analyst for Stockcharts.com and the main contributor to the ChartSchool.
PRINT THIS ARTICLE
REL. STR OSCILL
RSI Reaches Resistance Zone For SBC Corp.
03/09/05 09:02:04 AMby Arthur Hill
SBC Corp. has been trending lower over the last several months, and the relative strength index has reached an important resistance level.
Position: Sell
| While the relative strength index (RSI) is popular for identifying overbought and oversold levels, it can also identify trends and reversal zones. RSI oscillates between zero and 100 with readings above 70 deemed overbought and readings below 30 deemed oversold. However, when a stock is in a definitive downtrend, RSI is highly unlikely to make it as far as 70 and typically trades in a lower range, usually between 20 and 60. With this in mind, traders can prepare for bearish reversals when the indicator approaches the upper end of this range. |
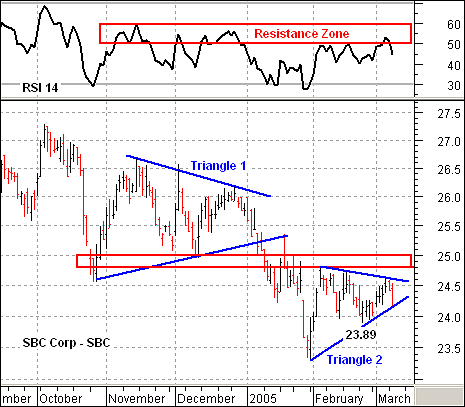
| SBC Corp. is clearly in a downtrend, and RSI continues to meet resistance between 50 and 60. The stock failed to partake in the October-December 2004 advance and formed a series of lower lows and lower highs over the last several months. Since October, RSI has traded below 30 three times and met resistance between 50 and 60 several times. The indicator is once again trading in the resistance zone and traders should be on guard for a continuation of the downtrend. |

|
| Figure 1: SBC Corp. SBC is clearly in a downtrend, and RSI continues to meet resistance between 50 and 60. |
| Graphic provided by: MetaStock. |
| Graphic provided by: Reuters Data. |
| |
| On the price chart, SBC formed a triangle in November-December and signaled a continuation lower with a support break in January. After a steep decline, the stock formed another triangle over the last few weeks and is testing lower trendline support. A move below this trendline and the late February low (23.89) would signal a continuation lower and project further weakness to around 20. |
| Two things are required to negate this bearish outlook and get the bull moving. First, RSI needs to break out of its resistance zone with a move above 60. Second, the stock needs to break above the upper triangle trendline and exceed the resistance zone around 24.8 to 25. This zone is confirmed by prior support and the February highs. The stock managed a sharp advance in early February, but there has yet to be any followthrough. Just to be safe, I would like to see followthough above the resistance zone before turning bullish. |
Arthur Hill is currently editor of TDTrader.com, a website specializing in trading strategies, sector/industry specific breadth stats and overall technical analysis. He passed the Society of Technical Analysts (STA London) diploma exam with distinction is a Certified Financial Technician (CFTe). Prior to TD Trader, he was the Chief Technical Analyst for Stockcharts.com and the main contributor to the ChartSchool.
| Title: | Editor |
| Company: | TDTrader.com |
| Address: | Willem Geetsstraat 17 |
| Mechelen, B2800 | |
| Phone # for sales: | 3215345465 |
| Website: | www.tdtrader.com |
| E-mail address: | arthurh@tdtrader.com |
Traders' Resource Links | |
| TDTrader.com has not added any product or service information to TRADERS' RESOURCE. | |
Click here for more information about our publications!
Comments
Date: 03/09/05Rank: 4Comment:

Request Information From Our Sponsors
- StockCharts.com, Inc.
- Candle Patterns
- Candlestick Charting Explained
- Intermarket Technical Analysis
- John Murphy on Chart Analysis
- John Murphy's Chart Pattern Recognition
- John Murphy's Market Message
- MurphyExplainsMarketAnalysis-Intermarket Analysis
- MurphyExplainsMarketAnalysis-Visual Analysis
- StockCharts.com
- Technical Analysis of the Financial Markets
- The Visual Investor
- VectorVest, Inc.
- Executive Premier Workshop
- One-Day Options Course
- OptionsPro
- Retirement Income Workshop
- Sure-Fire Trading Systems (VectorVest, Inc.)
- Trading as a Business Workshop
- VectorVest 7 EOD
- VectorVest 7 RealTime/IntraDay
- VectorVest AutoTester
- VectorVest Educational Services
- VectorVest OnLine
- VectorVest Options Analyzer
- VectorVest ProGraphics v6.0
- VectorVest ProTrader 7
- VectorVest RealTime Derby Tool
- VectorVest Simulator
- VectorVest Variator
- VectorVest Watchdog
