HOT TOPICS LIST
- MACD
- Fibonacci
- RSI
- Gann
- ADXR
- Stochastics
- Volume
- Triangles
- Futures
- Cycles
- Volatility
- ZIGZAG
- MESA
- Retracement
- Aroon
INDICATORS LIST
LIST OF TOPICS
PRINT THIS ARTICLE
by David Penn
With the new year-to-date high in the S&P 500, it appears all the more likely that a five-wave pattern is driving the market higher.
Position: N/A
David Penn
Technical Writer for Technical Analysis of STOCKS & COMMODITIES magazine, Working-Money.com, and Traders.com Advantage.
PRINT THIS ARTICLE
ELLIOTT WAVE
Fractals And Fifth Waves
03/08/05 11:06:49 AMby David Penn
With the new year-to-date high in the S&P 500, it appears all the more likely that a five-wave pattern is driving the market higher.
Position: N/A
| While many Elliott wave theorists suspected that the December 2004 highs marked the end of the bull market that began in 2002, I've maintained that this cyclical bull market was not quite over yet. And now, with an intermediate or secondary bullish Dow theory confirmation having arrived on Friday, March 4, bulls have the evidence they need to believe that the market is moving up. |
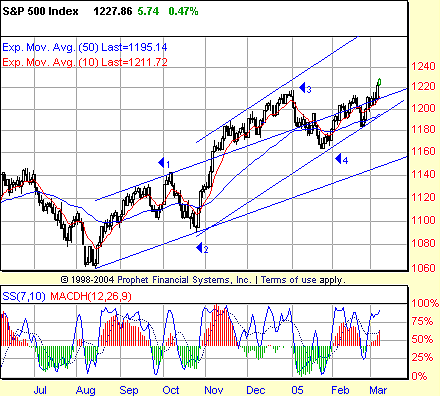
| Let me play a little cleanup on my previous wave counts. First, I like wave one as the October peak rather than as the September peak, as I'd suggested previously. What is best about this change is that it makes for a better wave two and wave four. Previously, with the wave one peak in September, wave two unfolded as a sort of six-week flat. Most important, that meant that the fourth-wave correction in January would have to be similarly sized--in magnitude if not in duration. That is what led to my speculation that the January correction would be, at first, a zigzag then later possibly a triangle. |

|
| Figure 1: The rally from the January 2005 lows so far looks like a miniature version of the larger rally from the August 2004 lows. |
| Graphic provided by: Prophet Financial, Inc. |
| |
| It now appears that the wave four correction--whatever it was--lasted only a month, and ended with questionable positive divergences in a number of averages and indexes (that is, some markets showed positive divergences in the stochastic with the January low, while others did not). It would be telling, if in fact the market has moved into a fifth wave, that the positive divergence that led to it was a weak or questionable one. |
| Something else buttresses my current impression of the waves in this bull move since August 2004. Note how the market from the late January 2005 bottom to early March looks almost identical to the market from the August 2004 bottom through November 2004. This, I believe, is a picture-perfect example of the fractal nature of wave patterns and suggests that we are in the sweet spot of the last leg of the market's nearly seven-month advance. (See Figure 1.) |
| Just for grins, I've made "Fischer projections" (Elliott wave projections based on the method described by Robert Fischer in his book, FIBONACCI APPLICATIONS AND STRATEGIES FOR TRADERS) of the wave count I've suggested best maps the rally of August 2004 to the present. With a wave one (August to October) from 1060 to 1140, we get a projected top at about 1270. With a wave three (October to December) extending to 1220, we get a projected top at about 1320. This suggests a range between 1270 and 1320 as containing the likely top for this move. While the prognosticator in me has suggested that the Standard & Poor's 500 could top lower (like at 1260; see my "Elliott Wave 2005," Working-Money.com, January 12, 2005), the technician in me will be sticking with this uptrend, as good as it gets and as long as it lasts. |
Technical Writer for Technical Analysis of STOCKS & COMMODITIES magazine, Working-Money.com, and Traders.com Advantage.
| Title: | Technical Writer |
| Company: | Technical Analysis, Inc. |
| Address: | 4757 California Avenue SW |
| Seattle, WA 98116 | |
| Phone # for sales: | 206 938 0570 |
| Fax: | 206 938 1307 |
| Website: | www.Traders.com |
| E-mail address: | DPenn@traders.com |
Traders' Resource Links | |
| Charting the Stock Market: The Wyckoff Method -- Books | |
| Working-Money.com -- Online Trading Services | |
| Traders.com Advantage -- Online Trading Services | |
| Technical Analysis of Stocks & Commodities -- Publications and Newsletters | |
| Working Money, at Working-Money.com -- Publications and Newsletters | |
| Traders.com Advantage -- Publications and Newsletters | |
| Professional Traders Starter Kit -- Software | |
Click here for more information about our publications!
Comments
Date: 03/08/05Rank: 5Comment:
Date: 03/09/05Rank: 4Comment:
Date: 03/15/05Rank: 2Comment:
Date: 03/15/05Rank: 3Comment:
Date: 03/15/05Rank: 4Comment:

|

Request Information From Our Sponsors
- StockCharts.com, Inc.
- Candle Patterns
- Candlestick Charting Explained
- Intermarket Technical Analysis
- John Murphy on Chart Analysis
- John Murphy's Chart Pattern Recognition
- John Murphy's Market Message
- MurphyExplainsMarketAnalysis-Intermarket Analysis
- MurphyExplainsMarketAnalysis-Visual Analysis
- StockCharts.com
- Technical Analysis of the Financial Markets
- The Visual Investor
- VectorVest, Inc.
- Executive Premier Workshop
- One-Day Options Course
- OptionsPro
- Retirement Income Workshop
- Sure-Fire Trading Systems (VectorVest, Inc.)
- Trading as a Business Workshop
- VectorVest 7 EOD
- VectorVest 7 RealTime/IntraDay
- VectorVest AutoTester
- VectorVest Educational Services
- VectorVest OnLine
- VectorVest Options Analyzer
- VectorVest ProGraphics v6.0
- VectorVest ProTrader 7
- VectorVest RealTime Derby Tool
- VectorVest Simulator
- VectorVest Variator
- VectorVest Watchdog
