HOT TOPICS LIST
- MACD
- Fibonacci
- RSI
- Gann
- ADXR
- Stochastics
- Volume
- Triangles
- Futures
- Cycles
- Volatility
- ZIGZAG
- MESA
- Retracement
- Aroon
INDICATORS LIST
LIST OF TOPICS
PRINT THIS ARTICLE
by Koos van der Merwe
On February 15, I argued that the US dollar has further to fall. Here is another chart and another argument that suggests just how low.
Position: Sell
Koos van der Merwe
Has been a technical analyst since 1969, and has worked as a futures and options trader with First Financial Futures in Johannesburg, South Africa.
PRINT THIS ARTICLE
ELLIOTT WAVE
Another Negative For The US Dollar
03/07/05 07:52:37 AMby Koos van der Merwe
On February 15, I argued that the US dollar has further to fall. Here is another chart and another argument that suggests just how low.
Position: Sell
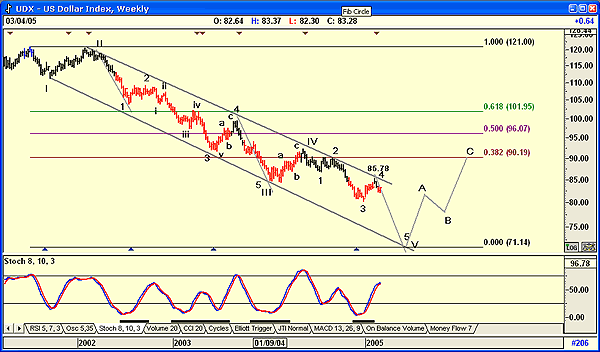
| Figure 1 is a simple Elliott wave chart of the US Dollar Index (UDX). What is disturbing is that the count is almost classic and suggests that Wave 5 will be in the 71.14 area, a further fall of 17.06% (85.78-71.14 = 14.64/85.78 = 0.1706 * 100 = 17.06%). This ties in with my article "Forecasting The US Dollar" of February 15, where I used the movement of the Canadian dollar to predict a further 16%-odd fall in the US dollar. |
| The chart is very roughly suggesting a low for the US dollar sometime in June/July or August, with a rise into an ABC correction taking it to the 90.19 level. This will be true should the US dollar fall to the 71.14 level as suggested in the chart, a level chosen because of the support line I,III,V. |

|
| Figure 1: A weekly chart of the US Dollar Index. The chart is roughly suggesting a low for the US dollar sometime in June/July or August, with a rise into an ABC correction taking it to the 90.19 level. |
| Graphic provided by: AdvancedGET. |
| |
| Of course, the US dollar could surprise us all and bottom out before this level, but the fact that I used a completely different technique to forecast a further 16% fall in the US dollar makes this one acceptable. |
| What happens after the high at "C" when the ABC correction occurs? By all accounts there should be another 5 wave down, but this impulse wave could hopefully be a flat, forming a double bottom at 71.14. Anything else will be too painful to consider. |
Has been a technical analyst since 1969, and has worked as a futures and options trader with First Financial Futures in Johannesburg, South Africa.
| Address: | 3256 West 24th Ave |
| Vancouver, BC | |
| Phone # for sales: | 6042634214 |
| E-mail address: | petroosp@gmail.com |
Click here for more information about our publications!
Comments
Date: 03/07/05Rank: 3Comment:
Date: 03/08/05Rank: 4Comment:
Date: 03/15/05Rank: 4Comment:

Request Information From Our Sponsors
- StockCharts.com, Inc.
- Candle Patterns
- Candlestick Charting Explained
- Intermarket Technical Analysis
- John Murphy on Chart Analysis
- John Murphy's Chart Pattern Recognition
- John Murphy's Market Message
- MurphyExplainsMarketAnalysis-Intermarket Analysis
- MurphyExplainsMarketAnalysis-Visual Analysis
- StockCharts.com
- Technical Analysis of the Financial Markets
- The Visual Investor
- VectorVest, Inc.
- Executive Premier Workshop
- One-Day Options Course
- OptionsPro
- Retirement Income Workshop
- Sure-Fire Trading Systems (VectorVest, Inc.)
- Trading as a Business Workshop
- VectorVest 7 EOD
- VectorVest 7 RealTime/IntraDay
- VectorVest AutoTester
- VectorVest Educational Services
- VectorVest OnLine
- VectorVest Options Analyzer
- VectorVest ProGraphics v6.0
- VectorVest ProTrader 7
- VectorVest RealTime Derby Tool
- VectorVest Simulator
- VectorVest Variator
- VectorVest Watchdog
