HOT TOPICS LIST
- MACD
- Fibonacci
- RSI
- Gann
- ADXR
- Stochastics
- Volume
- Triangles
- Futures
- Cycles
- Volatility
- ZIGZAG
- MESA
- Retracement
- Aroon
INDICATORS LIST
LIST OF TOPICS
PRINT THIS ARTICLE
by David Penn
When a stochastic divergence precedes a nondirectional chart pattern, that pattern is not likely to remain nondirectional for long.
Position: N/A
David Penn
Technical Writer for Technical Analysis of STOCKS & COMMODITIES magazine, Working-Money.com, and Traders.com Advantage.
PRINT THIS ARTICLE
REVERSAL
International Paper's Positive Pattern
03/07/05 11:41:59 AMby David Penn
When a stochastic divergence precedes a nondirectional chart pattern, that pattern is not likely to remain nondirectional for long.
Position: N/A
| There's been some interesting talk about the most recent bullishness in the market. Gary Kaltbaum of Investor's Edge, for example, has spoken recently about how so many of the stocks that are doing well (oil stocks, anyone?) in recent days have been "late-stage" stocks. By this, Kaltbaum means late in the economic cycle from the lowest point of the recession to the highest point in the recovery. |
| I've discussed sectors and the economic cycle frequently in articles for Working Money. Here, the essential point is that late in an economic expansion, raw materials companies tend to outperform other industries. The reasons for this are myriad, ranging from the relatively inflationary climate of late-state economic expansion to simply technical reactions to overly bearish opinions on steel, chemical, oil, and paper/lumber companies during the earlier part of the expansion (when growth is preferred). But there's no fading the maxim that when the smokestack stocks start dancing, the party is closer to being over than to just starting. |

|
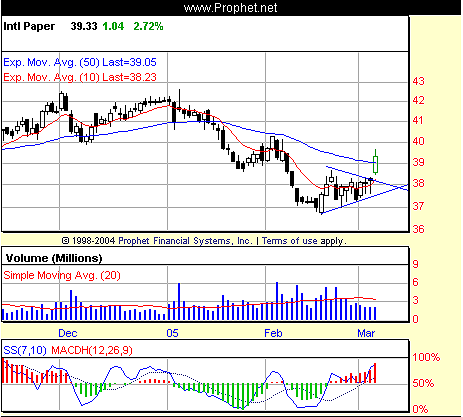
| Figure 1: International Paper. A positive stochastic divergence between the January and February lows in the IP stock helps anticipate that the breakout from the symmetrical triangle in the second half of February will be to the upside. |
| Graphic provided by: Prophet Financial, Inc. |
| |
| It was while looking at smokestack stocks like Great Lakes Chemical Corp. (GLK) that I discovered this move in International Paper (IP). It always pays to scroll through stocks in search of those that might appear down and out now, those potential value plays that could see a great deal of appreciation just by regressing to the mean. On that score, IP was among those stocks that seemed both to be falling on hard times and suggesting at least the possibility of a turnaround. The hard times have been apparent enough. From a high in early January just north of $42 per share, International Paper fell to as low as 37 by mid-February in a decline that provided precious little reason for hope for the bulls. As for the possibility of a turnaround, two factors combined to make a bounce in IP seem more likely than not. The first factor was the symmetrical triangle in the second half of February, and the second was the positive stochastic divergence between the January and February lows. |
| Generally, technical patterns like symmetrical triangles tend not to be directional. By that, I mean that there is nothing in the pattern itself that tells a trader or investor which direction any breakout will be. The compression of the triangle--which consists of two converging lines--suggests below normal volatility, and it is the stock's attempt to return to more normal or historical volatility that causes the breakout. But direction requires other tools. And, fortunately, those tools were present in the form of the positive stochastic divergence. By making higher lows while the price was making lower lows, the stochastic oscillator signaled that there was waning momentum to the downside, and that the increasingly greater risk was of a move to the upside. In the context of the symmetrical triangle, this further suggested an upside breakout from that mid- to late February consolidation. |
| If there is one thing the breakout is lacking, then that thing would be overwhelming volume. Traders and analysts should keep an eye out for any followthrough to the upside in subsequent days, especially if there is an increase in volume. |
Technical Writer for Technical Analysis of STOCKS & COMMODITIES magazine, Working-Money.com, and Traders.com Advantage.
| Title: | Technical Writer |
| Company: | Technical Analysis, Inc. |
| Address: | 4757 California Avenue SW |
| Seattle, WA 98116 | |
| Phone # for sales: | 206 938 0570 |
| Fax: | 206 938 1307 |
| Website: | www.Traders.com |
| E-mail address: | DPenn@traders.com |
Traders' Resource Links | |
| Charting the Stock Market: The Wyckoff Method -- Books | |
| Working-Money.com -- Online Trading Services | |
| Traders.com Advantage -- Online Trading Services | |
| Technical Analysis of Stocks & Commodities -- Publications and Newsletters | |
| Working Money, at Working-Money.com -- Publications and Newsletters | |
| Traders.com Advantage -- Publications and Newsletters | |
| Professional Traders Starter Kit -- Software | |
Click here for more information about our publications!
Comments
Date: 03/07/05Rank: 3Comment:
Date: 03/08/05Rank: 4Comment:

Request Information From Our Sponsors
- StockCharts.com, Inc.
- Candle Patterns
- Candlestick Charting Explained
- Intermarket Technical Analysis
- John Murphy on Chart Analysis
- John Murphy's Chart Pattern Recognition
- John Murphy's Market Message
- MurphyExplainsMarketAnalysis-Intermarket Analysis
- MurphyExplainsMarketAnalysis-Visual Analysis
- StockCharts.com
- Technical Analysis of the Financial Markets
- The Visual Investor
- VectorVest, Inc.
- Executive Premier Workshop
- One-Day Options Course
- OptionsPro
- Retirement Income Workshop
- Sure-Fire Trading Systems (VectorVest, Inc.)
- Trading as a Business Workshop
- VectorVest 7 EOD
- VectorVest 7 RealTime/IntraDay
- VectorVest AutoTester
- VectorVest Educational Services
- VectorVest OnLine
- VectorVest Options Analyzer
- VectorVest ProGraphics v6.0
- VectorVest ProTrader 7
- VectorVest RealTime Derby Tool
- VectorVest Simulator
- VectorVest Variator
- VectorVest Watchdog
