HOT TOPICS LIST
- MACD
- Fibonacci
- RSI
- Gann
- ADXR
- Stochastics
- Volume
- Triangles
- Futures
- Cycles
- Volatility
- ZIGZAG
- MESA
- Retracement
- Aroon
INDICATORS LIST
LIST OF TOPICS
PRINT THIS ARTICLE
by Jayanthi Gopalakrishnan
One stock that has stirred attention in the news is Microsoft Corp. [MSFT]. A stock that was growing at a steady rate had taken a beating due to certain fundamental factors affecting the stock negatively.
Position: N/A
Jayanthi Gopalakrishnan
PRINT THIS ARTICLE
Stock To Watch-Microsoft Corp. [MSFT]
06/15/00 01:39:10 PMby Jayanthi Gopalakrishnan
One stock that has stirred attention in the news is Microsoft Corp. [MSFT]. A stock that was growing at a steady rate had taken a beating due to certain fundamental factors affecting the stock negatively.
Position: N/A
| The company's stock has shown up as green in the stock screens for the last couple of trading days. Does this mean it's a good time to buy the stock? |
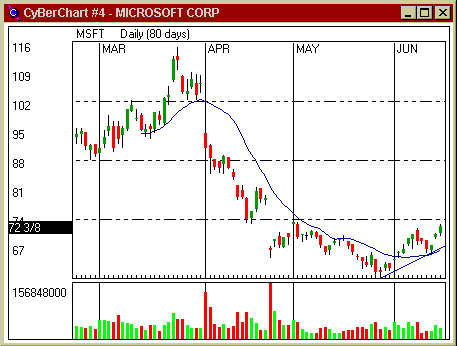
| Take a look at the chart of MSFT. The stock shows subtle signs of being in an upward trend. The 15-day moving average, which had been sloping downward, is showing signs of flattening out and prices seem to be trending upwards as can be seen by the blue trendline in the lower right-hand corner of the chart. |

|
| Graphic provided by: CyBer Corp, Inc.. |
| |
| However, I am still hesitant to purchase shares at this time. One problem is that volume is not higher than average. The second is that MSFT seems to be trading sideways. The stock looks like it may be approaching the top of its trading range and forming a resistance level. |
| Given this scenario, is this a good time to buy the stock? I would say no. However, I have added the stock to my watch list and am monitoring it closely. I have placed an alert close to $74, the top of the trading range, and if the price reached this level I would consider purchasing it. This would depend on various other indicators, so stay tuned and when the price reaches this level look for a follow-up discussion. |
| Title: | Editor |
| Company: | Technical Analysis of Stocks & Commodities |
| Address: | 4757 California Ave SW |
| Seattle, WA 98116 | |
| Website: | Traders.com |
| E-mail address: | Jayanthi@traders.com |
Traders' Resource Links | |
| Charting the Stock Market: The Wyckoff Method -- Books | |
| Working-Money.com -- Online Trading Services | |
| Traders.com Advantage -- Online Trading Services | |
| Technical Analysis of Stocks & Commodities -- Publications and Newsletters | |
| Working Money, at Working-Money.com -- Publications and Newsletters | |
| Traders.com Advantage -- Publications and Newsletters | |
| Professional Traders Starter Kit -- Software | |
Click here for more information about our publications!
Comments

Request Information From Our Sponsors
- StockCharts.com, Inc.
- Candle Patterns
- Candlestick Charting Explained
- Intermarket Technical Analysis
- John Murphy on Chart Analysis
- John Murphy's Chart Pattern Recognition
- John Murphy's Market Message
- MurphyExplainsMarketAnalysis-Intermarket Analysis
- MurphyExplainsMarketAnalysis-Visual Analysis
- StockCharts.com
- Technical Analysis of the Financial Markets
- The Visual Investor
- VectorVest, Inc.
- Executive Premier Workshop
- One-Day Options Course
- OptionsPro
- Retirement Income Workshop
- Sure-Fire Trading Systems (VectorVest, Inc.)
- Trading as a Business Workshop
- VectorVest 7 EOD
- VectorVest 7 RealTime/IntraDay
- VectorVest AutoTester
- VectorVest Educational Services
- VectorVest OnLine
- VectorVest Options Analyzer
- VectorVest ProGraphics v6.0
- VectorVest ProTrader 7
- VectorVest RealTime Derby Tool
- VectorVest Simulator
- VectorVest Variator
- VectorVest Watchdog
