HOT TOPICS LIST
- MACD
- Fibonacci
- RSI
- Gann
- ADXR
- Stochastics
- Volume
- Triangles
- Futures
- Cycles
- Volatility
- ZIGZAG
- MESA
- Retracement
- Aroon
INDICATORS LIST
LIST OF TOPICS
PRINT THIS ARTICLE
by David Penn
Can an option chart help traders get a jump on a move in the underlying stock?
Position: N/A
David Penn
Technical Writer for Technical Analysis of STOCKS & COMMODITIES magazine, Working-Money.com, and Traders.com Advantage.
PRINT THIS ARTICLE
OPTIONS ANALYSIS
Charting QQQQ Options
03/03/05 03:39:00 PMby David Penn
Can an option chart help traders get a jump on a move in the underlying stock?
Position: N/A
| I made the case for analyzing price charts of actual options prices in a recent Working-Money.com article ("Charting Options," January 27, 2005). Drawing from the observations of options expert Price Headley in his book BIG TRENDS IN TRADING, I agreed that charting actual options prices is a valid strategy for those interested in trading options. |
| In some instances, charts of the options can alert a trader to an opportunity a day before the underlying stock reveals its move. This was the case for me recently with Placer Dome (PDG). Using the moving average convergence/divergence histogram (MACDH)/stochastic/50-day exponential moving average (EMA) context I've mentioned before, I saw a sell point develop in Placer Dome on February 24. However, when I went to look at put options on Placer Dome, I noticed that the March 17.50 put had created (using the same technical context) a buy point a day earlier, on February 23. |

|
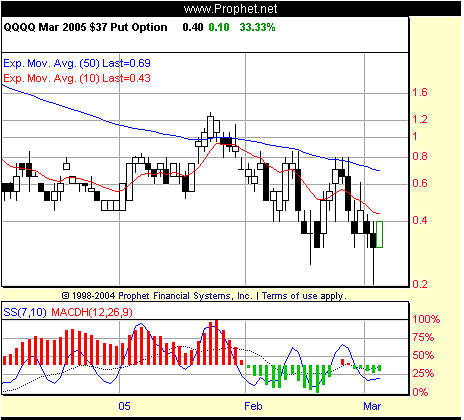
| Figure 1: QQQQ. The March 37 puts in the QQQQ bounce courtesy of a positive stochastic divergence and an upside reversal in the MACDH. |
| Graphic provided by: Prophet Financial, Inc. |
| |
| The difference a day made? Buying the option on February 25 (after the underlying's sell point on February 24) would have cost at least 55 cents. The same option on February 24 (a day after the put option's buy point on February 23) would have cost 30 cents. |
| The scenario with the QQQQ does not seem quite as fortuitous. The developing buy point in the options chart shown in Figure 1 corresponds to the day with a developing sell point in the stock chart. This is an intraday look, so it is possible that the buy and sell points I'm referring to may disappear if the market moves significantly lower (or higher, respectively). But if the markets close approximately as they appear right now, then the opportunity will be in place. |
| The opportunity in the QQQQ options is apparent in the March 37 puts (QQQ-OK). Specifically, I'm talking about a positive stochastic divergence between the mid-February lows and the lows early in March. This divergence looks as if it will be triggered by the upside reversal in the MACDH on March 3 (again, if current conditions hold through the close). A confirmation (see my Working-Money.com article, "Confirming Divergences," from December 22) for this positive divergence has already occurred--specifically when QQQ-OK rallied above the 40-45 cent level (shortly after the chart in Figure 1 was captured). |
Technical Writer for Technical Analysis of STOCKS & COMMODITIES magazine, Working-Money.com, and Traders.com Advantage.
| Title: | Technical Writer |
| Company: | Technical Analysis, Inc. |
| Address: | 4757 California Avenue SW |
| Seattle, WA 98116 | |
| Phone # for sales: | 206 938 0570 |
| Fax: | 206 938 1307 |
| Website: | www.Traders.com |
| E-mail address: | DPenn@traders.com |
Traders' Resource Links | |
| Charting the Stock Market: The Wyckoff Method -- Books | |
| Working-Money.com -- Online Trading Services | |
| Traders.com Advantage -- Online Trading Services | |
| Technical Analysis of Stocks & Commodities -- Publications and Newsletters | |
| Working Money, at Working-Money.com -- Publications and Newsletters | |
| Traders.com Advantage -- Publications and Newsletters | |
| Professional Traders Starter Kit -- Software | |
Click here for more information about our publications!
Comments
Date: 03/07/05Rank: 3Comment:
Date: 03/08/05Rank: 5Comment:

|

Request Information From Our Sponsors
- StockCharts.com, Inc.
- Candle Patterns
- Candlestick Charting Explained
- Intermarket Technical Analysis
- John Murphy on Chart Analysis
- John Murphy's Chart Pattern Recognition
- John Murphy's Market Message
- MurphyExplainsMarketAnalysis-Intermarket Analysis
- MurphyExplainsMarketAnalysis-Visual Analysis
- StockCharts.com
- Technical Analysis of the Financial Markets
- The Visual Investor
- VectorVest, Inc.
- Executive Premier Workshop
- One-Day Options Course
- OptionsPro
- Retirement Income Workshop
- Sure-Fire Trading Systems (VectorVest, Inc.)
- Trading as a Business Workshop
- VectorVest 7 EOD
- VectorVest 7 RealTime/IntraDay
- VectorVest AutoTester
- VectorVest Educational Services
- VectorVest OnLine
- VectorVest Options Analyzer
- VectorVest ProGraphics v6.0
- VectorVest ProTrader 7
- VectorVest RealTime Derby Tool
- VectorVest Simulator
- VectorVest Variator
- VectorVest Watchdog
