HOT TOPICS LIST
- MACD
- Fibonacci
- RSI
- Gann
- ADXR
- Stochastics
- Volume
- Triangles
- Futures
- Cycles
- Volatility
- ZIGZAG
- MESA
- Retracement
- Aroon
INDICATORS LIST
LIST OF TOPICS
PRINT THIS ARTICLE
by Kevin Hopson
Pitchforks have been accurate in predicting both breakout points and reversal points for natural gas prices.
Position: N/A
Kevin Hopson
Kevin has been a technical analyst for roughly 10 years now. Previously, Kevin owned his own business and acted as a registered investment advisor, specializing in energy. He was also a freelance oil analyst for Orient Trading Co., a commodity futures trading firm in Japan. Kevin is currently a freelance writer.
PRINT THIS ARTICLE
ANDREWS PITCH-FORK
Pitchfork Analysis For Natural Gas
03/03/05 08:00:16 AMby Kevin Hopson
Pitchforks have been accurate in predicting both breakout points and reversal points for natural gas prices.
Position: N/A
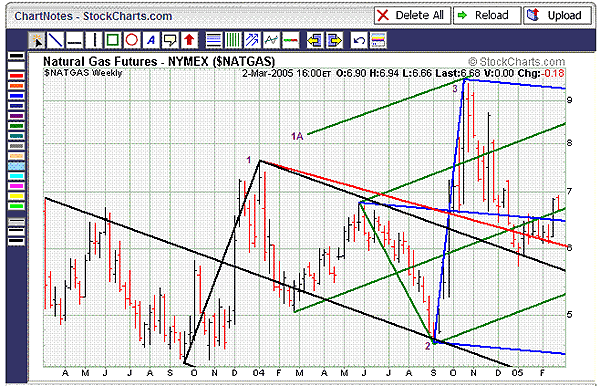
| When I analyze a stock, commodity, exchange-traded fund, or any other kind of investment vehicle, I depend on a variety of technical tools. However, sometimes one tool is all you need, which I found to be the case with natural gas ($NATGAS). If you look at the two-year weekly chart for natural gas (Figure 1), you will note that pitchforks are today's theme. Though the chart may look complex, pitchforks have a way of making things simple. |
| For example, note how natural gas prices were stuck in the top half of the black pitchfork for the first nine months of 2004. When prices broke to the upside in late September, it was a significant long-term development. More specifically, when natural gas breached the top parallel line (around $6.30), prices rallied up to the $9.50 level in a matter of weeks. This rally was eventually halted at the 1A channel line, which is an extension of the green pitchfork. In other words, the distance between the green median line and the upper parallel line was added to the top of the pitchfork. This created another trading channel when the top parallel line was breached. |

|
| Figure 1: Natural gas. If you look at this two-year weekly chart for natural gas, you will note that pitchforks are today's theme. |
| Graphic provided by: StockCharts.com. |
| |
| When natural gas reversed at the 1A channel line and proceeded to pull back, prices ultimately found support along the top black parallel line -- the same line that the contract overcame a few months earlier. As you probably know, prior resistance levels tend to act as support during pullbacks. As a result, it was no surprise that prices reversed here. |
| Since the first week of January 2005, prices had been consolidating between support and resistance. More specifically, prices were finding support along the red median line but were also encountering resistance along the blue and green median lines. However, note how these two median lines were recently overcome, and prices are now finding support along the green median line. As long as natural gas can stay above this median line (around $6.70), the short-term trend will remain positive. In addition, prices could make their way up to the $7.20 level, which is the site of the 38.2% retracement from the October-January decline and last December's high. |
Kevin has been a technical analyst for roughly 10 years now. Previously, Kevin owned his own business and acted as a registered investment advisor, specializing in energy. He was also a freelance oil analyst for Orient Trading Co., a commodity futures trading firm in Japan. Kevin is currently a freelance writer.
| Glen Allen, VA | |
| E-mail address: | hopson_1@yahoo.com |
Click here for more information about our publications!
Comments
Date: 03/07/05Rank: 4Comment:

|

Request Information From Our Sponsors
- StockCharts.com, Inc.
- Candle Patterns
- Candlestick Charting Explained
- Intermarket Technical Analysis
- John Murphy on Chart Analysis
- John Murphy's Chart Pattern Recognition
- John Murphy's Market Message
- MurphyExplainsMarketAnalysis-Intermarket Analysis
- MurphyExplainsMarketAnalysis-Visual Analysis
- StockCharts.com
- Technical Analysis of the Financial Markets
- The Visual Investor
- VectorVest, Inc.
- Executive Premier Workshop
- One-Day Options Course
- OptionsPro
- Retirement Income Workshop
- Sure-Fire Trading Systems (VectorVest, Inc.)
- Trading as a Business Workshop
- VectorVest 7 EOD
- VectorVest 7 RealTime/IntraDay
- VectorVest AutoTester
- VectorVest Educational Services
- VectorVest OnLine
- VectorVest Options Analyzer
- VectorVest ProGraphics v6.0
- VectorVest ProTrader 7
- VectorVest RealTime Derby Tool
- VectorVest Simulator
- VectorVest Variator
- VectorVest Watchdog
