HOT TOPICS LIST
- MACD
- Fibonacci
- RSI
- Gann
- ADXR
- Stochastics
- Volume
- Triangles
- Futures
- Cycles
- Volatility
- ZIGZAG
- MESA
- Retracement
- Aroon
INDICATORS LIST
LIST OF TOPICS
PRINT THIS ARTICLE
by David Penn
Does a positive stochastic divergence suggest brighter times ahead for the beaten and battered shares of Lucent?
Position: N/A
David Penn
Technical Writer for Technical Analysis of STOCKS & COMMODITIES magazine, Working-Money.com, and Traders.com Advantage.
PRINT THIS ARTICLE
REVERSAL
Is Lucent Looking Up?
03/03/05 12:30:23 PMby David Penn
Does a positive stochastic divergence suggest brighter times ahead for the beaten and battered shares of Lucent?
Position: N/A
| Every stock trader has a closet in which the skeletal remains of some stock that was sold too late or bought too soon may be found. For "RealMoney" host Jim Cramer, that stock, those remains, are of Lucent Technologies (LU). |
| Because every trader goes through this syndrome from time to time, there is really no need to spell out or decipher how Cramer's affection for Lucent became an addiction to averaging down (a strategy he employs frequently) and metastasized into a full-scale aversion to parting with the shares. The more important question is whether at this point that affection/addiction/aversion can be profitable. |

|
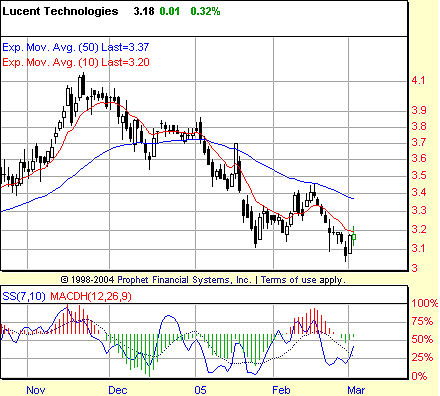
| Figure 1: LU. Will a positive stochastic divergence between the January and late February lows lead to a long-waited-for bounce in shares of Lucent? |
| Graphic provided by: Prophet Financial, Inc. |
| |
| Lucent topped out in January 2004 just shy of $5 a share. The November 2004 peak at about 4.1 shown in Figure 1 comes in the wake of a rally from a shorter-term bottom in August 2004 (the same bottom that produced the August 2004-January 2005 "Bush Bounce"). Since then, shares have truly plummeted--falling as low as 3.05 in late February--with the occasional bounces in mid-January and mid-February only setting up opportunities for further declines. |
| There appears to be a decent chance of yet another bounce here in early March. Note how the 7,10 stochastic makes higher lows in late January and late February, higher lows that correspond with the lower lows in Lucent's share price over the same time frame. This kind of oscillator/price relationship is the signature of a positive stochastic divergence, the kind of divergence that often leads to higher prices in the near term. While not infallible, positive stochastic divergences often help set up attractive risk/reward opportunities for traders. |
| Will Lucent's positive stochastic divergence in the first few months of 2005 lead to such opportunities? Combining the positive stochastic divergence with the moving average convergence/divergence histogram (MACDH)-based entry that I've discussed frequently in Traders.com Advantage and in Working-Money.com, it appears as if there is a buy point in Lucent at 3.23. With Lucent reaching an intraday high of 3.22 on March 2, we won't have an answer, one way or the other, as of this writing. But with a "tap or snap" point at the February 28th intraday low of 3.04, those who elect to go long Lucent at these levels won't have long to wait before they know if the light is shining on Lucent once again. |
Technical Writer for Technical Analysis of STOCKS & COMMODITIES magazine, Working-Money.com, and Traders.com Advantage.
| Title: | Technical Writer |
| Company: | Technical Analysis, Inc. |
| Address: | 4757 California Avenue SW |
| Seattle, WA 98116 | |
| Phone # for sales: | 206 938 0570 |
| Fax: | 206 938 1307 |
| Website: | www.Traders.com |
| E-mail address: | DPenn@traders.com |
Traders' Resource Links | |
| Charting the Stock Market: The Wyckoff Method -- Books | |
| Working-Money.com -- Online Trading Services | |
| Traders.com Advantage -- Online Trading Services | |
| Technical Analysis of Stocks & Commodities -- Publications and Newsletters | |
| Working Money, at Working-Money.com -- Publications and Newsletters | |
| Traders.com Advantage -- Publications and Newsletters | |
| Professional Traders Starter Kit -- Software | |
Click here for more information about our publications!
Comments
Date: 03/07/05Rank: 3Comment:
Date: 03/08/05Rank: 4Comment:

Request Information From Our Sponsors
- StockCharts.com, Inc.
- Candle Patterns
- Candlestick Charting Explained
- Intermarket Technical Analysis
- John Murphy on Chart Analysis
- John Murphy's Chart Pattern Recognition
- John Murphy's Market Message
- MurphyExplainsMarketAnalysis-Intermarket Analysis
- MurphyExplainsMarketAnalysis-Visual Analysis
- StockCharts.com
- Technical Analysis of the Financial Markets
- The Visual Investor
- VectorVest, Inc.
- Executive Premier Workshop
- One-Day Options Course
- OptionsPro
- Retirement Income Workshop
- Sure-Fire Trading Systems (VectorVest, Inc.)
- Trading as a Business Workshop
- VectorVest 7 EOD
- VectorVest 7 RealTime/IntraDay
- VectorVest AutoTester
- VectorVest Educational Services
- VectorVest OnLine
- VectorVest Options Analyzer
- VectorVest ProGraphics v6.0
- VectorVest ProTrader 7
- VectorVest RealTime Derby Tool
- VectorVest Simulator
- VectorVest Variator
- VectorVest Watchdog
