HOT TOPICS LIST
- MACD
- Fibonacci
- RSI
- Gann
- ADXR
- Stochastics
- Volume
- Triangles
- Futures
- Cycles
- Volatility
- ZIGZAG
- MESA
- Retracement
- Aroon
INDICATORS LIST
LIST OF TOPICS
PRINT THIS ARTICLE
by Kevin Hopson
A double-pattern breakout indicates higher crude oil prices in the long term.
Position: N/A
Kevin Hopson
Kevin has been a technical analyst for roughly 10 years now. Previously, Kevin owned his own business and acted as a registered investment advisor, specializing in energy. He was also a freelance oil analyst for Orient Trading Co., a commodity futures trading firm in Japan. Kevin is currently a freelance writer.
PRINT THIS ARTICLE
TECHNICAL ANALYSIS
Crude Oil's Breakout
03/03/05 12:24:26 PMby Kevin Hopson
A double-pattern breakout indicates higher crude oil prices in the long term.
Position: N/A
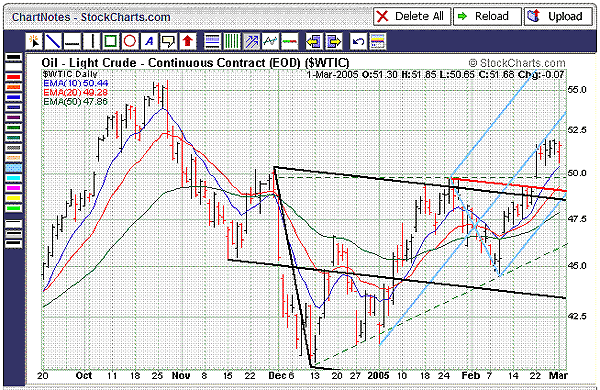
| The continuous light crude futures contract ($WTIC) has overcome two significant obstacles, paving the way for a longer-term move higher. For example, if you look at the six-month chart, you will see that prices were trading in the top half of the black pitchfork since early January. However, in late February, crude oil prices broke out of this pitchfork configuration, moving above the sliding red parallel line in the process. |
| In addition, note how the contract formed an ascending triangle pattern the last three months, as illustrated by the dotted green lines. When crude oil broke out of the pitchfork configuration, prices also moved above the top line of the ascending triangle formation. As a result, this was a clear buy signal. If you take the base of the triangle (high point - low point) and add this figure ($50.00-$40.00=$10.00) to the point of breakout ($50.00), you come up with a price target of $60.00 ($50.00+$10.00=$60.00). |

|
| Figure 1: Crude oil, six-month chart. A double pattern breakout indicates higher crude oil prices in the long term. |
| Graphic provided by: StockCharts.com. |
| |
| However, prices could pull back before making a run at the $60.00 level. This is because trading activity has been bearish in recent weeks. More specifically, during the runup the last several weeks, commercials (smart money) have failed to build significant long positions. Instead, they have been covering their short positions, while noncommercials (speculative money) have been the primary buyers. This means that much of the recent price rise has been due to short-covering and speculative buying, which tends to be bearish. |
| Moreover, commercials increased their net short position by 27,452 contracts last week, while noncommercials increased their net long position by 22,548 contracts. Because commercials tend to be a leading indicator and noncommercials tend to be a contrarian (or lagging) indicator, there is a significant bias toward lower prices in the near term. If we do see a pullback, which would be healthy at this point, look for key short-term support in the $49.00 to $50.00 range. This is the site of last month's triple-top breakout (ascending triangle), February's unfilled gap, the contract's 20-day exponential moving average, and the bottom blue parallel line. |
Kevin has been a technical analyst for roughly 10 years now. Previously, Kevin owned his own business and acted as a registered investment advisor, specializing in energy. He was also a freelance oil analyst for Orient Trading Co., a commodity futures trading firm in Japan. Kevin is currently a freelance writer.
| Glen Allen, VA | |
| E-mail address: | hopson_1@yahoo.com |
Click here for more information about our publications!
Comments
Date: 03/07/05Rank: 3Comment:
Date: 03/08/05Rank: 3Comment:

Request Information From Our Sponsors
- VectorVest, Inc.
- Executive Premier Workshop
- One-Day Options Course
- OptionsPro
- Retirement Income Workshop
- Sure-Fire Trading Systems (VectorVest, Inc.)
- Trading as a Business Workshop
- VectorVest 7 EOD
- VectorVest 7 RealTime/IntraDay
- VectorVest AutoTester
- VectorVest Educational Services
- VectorVest OnLine
- VectorVest Options Analyzer
- VectorVest ProGraphics v6.0
- VectorVest ProTrader 7
- VectorVest RealTime Derby Tool
- VectorVest Simulator
- VectorVest Variator
- VectorVest Watchdog
- StockCharts.com, Inc.
- Candle Patterns
- Candlestick Charting Explained
- Intermarket Technical Analysis
- John Murphy on Chart Analysis
- John Murphy's Chart Pattern Recognition
- John Murphy's Market Message
- MurphyExplainsMarketAnalysis-Intermarket Analysis
- MurphyExplainsMarketAnalysis-Visual Analysis
- StockCharts.com
- Technical Analysis of the Financial Markets
- The Visual Investor
