HOT TOPICS LIST
- MACD
- Fibonacci
- RSI
- Gann
- ADXR
- Stochastics
- Volume
- Triangles
- Futures
- Cycles
- Volatility
- ZIGZAG
- MESA
- Retracement
- Aroon
INDICATORS LIST
LIST OF TOPICS
PRINT THIS ARTICLE
by David Penn
Positive stochastic divergences on monthly and daily charts suggest the potential for more upside in the 10-year Treasury note.
Position: N/A
David Penn
Technical Writer for Technical Analysis of STOCKS & COMMODITIES magazine, Working-Money.com, and Traders.com Advantage.
PRINT THIS ARTICLE
REVERSAL
About Those Bonds
03/02/05 01:31:59 PMby David Penn
Positive stochastic divergences on monthly and daily charts suggest the potential for more upside in the 10-year Treasury note.
Position: N/A
| Some six weeks ago, I returned to the bearish argument on bonds (or the bullish argument on interest rates). In that article, "Bad News Bonds" (Traders.com Advantage, January 7), I set the bond market in the context of a gold market that had topped and a market for US dollars that was just getting ready to move significantly higher. Recent action in gold and the dollar have made these bearish and bullish projections (respectively) seem off. But the movement in bonds suggests that their bear market (and a simultaneous bull market in rates) is right on schedule. |
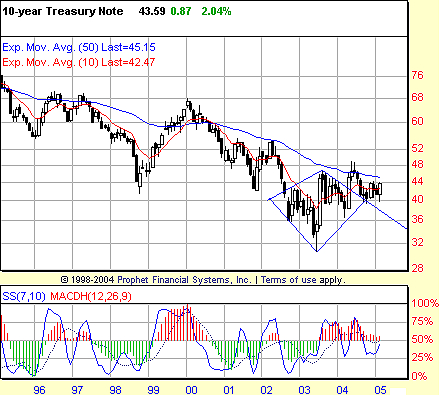
| Both long- and intermediate-term pictures buttress the case for higher rates in the 10-year note. The "death star" diamond top I pointed out in "Bad News Bonds" is no less apparent in the chart of the $TNX, the proxy for the 10-year T-note's interest rate. You'll note also that the upside projections I mentioned six weeks ago hold true for the diamond bottom presented here: a minimum upside between 5.5 and 6.0. |

|
| Figure 1: Treasury notes, 1996-2005. The breakout from this long-term diamond bottom has pulled back somewhat over the balance of 2004. But support at the 4.0 level has been intact for almost a year. |
| Graphic provided by: Prophet Financial, Inc. |
| |
| One of the factors that suggest to me that the diamond pattern in Figure 1 is a diamond bottom is the positive stochastic divergence in the 2002-03 timeframe. Specifically, note how successively higher stochastic troughs match the successively lower price troughs in 2002 and in 2003. Combined with the monthly hammer candlestick on the 2003 low, this is a powerfully bullish technical development. That last time the $TNX showed a positive stochastic divergence on the monthly chart, it was back in the 1998-99 time frame. Then, rates on the 10-year note bottomed late in 1998 near 4.4 and soared to almost 6.8 in a little over a year. |
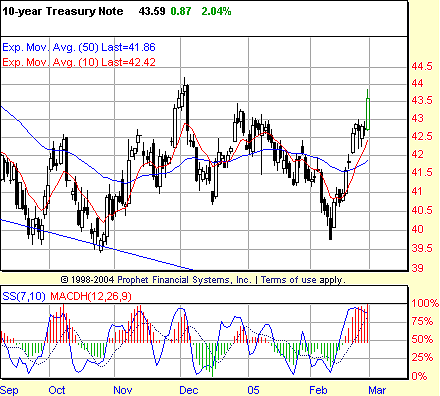
Similarly bullish stochastic divergences are taking place on the daily chart. In the daily chart in Figure 2, compare the lower lows in January and February in the $TNX with the higher lows in the stochastic at the same time. Again, we have a classic positive divergence between price action and the oscillator. In this case, the positive divergence anticipated the sharp upward rally in rates that took place over the second half of February. Figure 2: September 2004-March 2005 chart. The positive stochastic divergence in January and February sent $TNX hurtling toward a test of the December 2004 highs. At the present time, the daily $TNX is moving almost vertically, which begs a pullback or correction of some sort (the $TNX has moved from under 4.0 to over 4.35 in just over two weeks). In the event of such a reaction, it will be interesting to see whether $TNX finds support at either the 10- or 50-day exponential moving averages (EMA). As the chart shows, these moving averages haven't acted as particularly effective resistance or support levels, as the $TNX has plunged below and broken out above these averages many times over the past several months. |
| Nevertheless, the monthly chart is clear that there is support at 4.0, support that has held for almost a year. Even if $TNX collapses in a retracement in March as rapidly as it rose in February, the 4.0 level will remain the "line in the sand" dividing higher rates from even more historically low long-term rates. |
Technical Writer for Technical Analysis of STOCKS & COMMODITIES magazine, Working-Money.com, and Traders.com Advantage.
| Title: | Technical Writer |
| Company: | Technical Analysis, Inc. |
| Address: | 4757 California Avenue SW |
| Seattle, WA 98116 | |
| Phone # for sales: | 206 938 0570 |
| Fax: | 206 938 1307 |
| Website: | www.Traders.com |
| E-mail address: | DPenn@traders.com |
Traders' Resource Links | |
| Charting the Stock Market: The Wyckoff Method -- Books | |
| Working-Money.com -- Online Trading Services | |
| Traders.com Advantage -- Online Trading Services | |
| Technical Analysis of Stocks & Commodities -- Publications and Newsletters | |
| Working Money, at Working-Money.com -- Publications and Newsletters | |
| Traders.com Advantage -- Publications and Newsletters | |
| Professional Traders Starter Kit -- Software | |
Click here for more information about our publications!
Comments
Date: 03/02/05Rank: 3Comment:
Date: 03/03/05Rank: 4Comment:

|

Request Information From Our Sponsors
- StockCharts.com, Inc.
- Candle Patterns
- Candlestick Charting Explained
- Intermarket Technical Analysis
- John Murphy on Chart Analysis
- John Murphy's Chart Pattern Recognition
- John Murphy's Market Message
- MurphyExplainsMarketAnalysis-Intermarket Analysis
- MurphyExplainsMarketAnalysis-Visual Analysis
- StockCharts.com
- Technical Analysis of the Financial Markets
- The Visual Investor
- VectorVest, Inc.
- Executive Premier Workshop
- One-Day Options Course
- OptionsPro
- Retirement Income Workshop
- Sure-Fire Trading Systems (VectorVest, Inc.)
- Trading as a Business Workshop
- VectorVest 7 EOD
- VectorVest 7 RealTime/IntraDay
- VectorVest AutoTester
- VectorVest Educational Services
- VectorVest OnLine
- VectorVest Options Analyzer
- VectorVest ProGraphics v6.0
- VectorVest ProTrader 7
- VectorVest RealTime Derby Tool
- VectorVest Simulator
- VectorVest Variator
- VectorVest Watchdog
