HOT TOPICS LIST
- MACD
- Fibonacci
- RSI
- Gann
- ADXR
- Stochastics
- Volume
- Triangles
- Futures
- Cycles
- Volatility
- ZIGZAG
- MESA
- Retracement
- Aroon
INDICATORS LIST
LIST OF TOPICS
PRINT THIS ARTICLE
by Gary Grosschadl
Oil indexes and many oil stocks have had a considerable rise since the price of oil broke above $45 in early 2005. Is this move overextended?
Position: Sell
Gary Grosschadl
Independent Canadian equities trader and technical analyst based in Peterborough
Ontario, Canada.
PRINT THIS ARTICLE
CHART ANALYSIS
Imperial Oil's Regal Rise
03/01/05 08:15:00 AMby Gary Grosschadl
Oil indexes and many oil stocks have had a considerable rise since the price of oil broke above $45 in early 2005. Is this move overextended?
Position: Sell
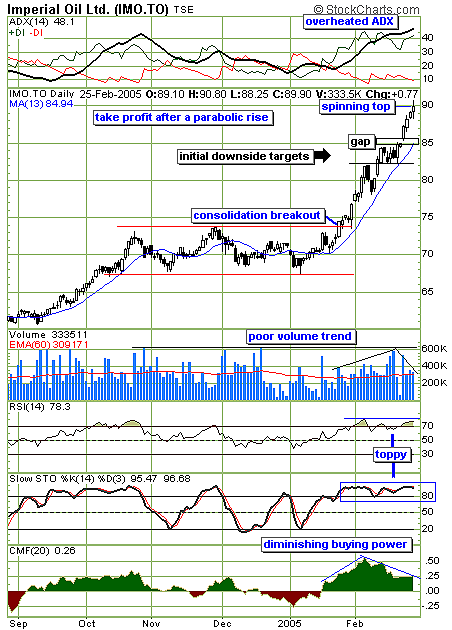
| Imperial Oil, Canada's oil and gas giant, has joined the oil foray to new heights. In my mind, the burning question is whether it has gotten ahead of itself. While the various oil indexes look extremely bullish, Figure 1, a chart of IMO, shows a few areas of concern. |
| After a four-month consolidation, this stock broke past $74 in early 2005. Three weeks later, another, briefer consolidation occurred between $82 and $85. A gap launched this next move to a bold advance to the $90 realm, and here is where the first potential warning candlestick appears. Friday's session closed with a spinning top. This small-bodied candlestick with shadows on either end can signal a tug-of-war between the bulls and the bears, the first sign of what could turn out to be an indication of the prior trend running out of steam. It would take a close above the high of $90.80 to negate the spinning top warning. |

|
| Figure 1: Imperial Oil. This daily chart suggests this move may be getting ahead of itself. |
| Graphic provided by: StockCharts.com. |
| |
| This candlestick caution does have some allies in the form of several indicators. The average directional movement (ADX) indicator at the top of the chart is considered overheated, as it is above previous highs and above +DI. Similar to other indicators like the stochastics, these indicators can stay overbought for extended periods in very strong trends. Nonetheless, what goes up too high will correct eventually. |
| The volume trend does not lend itself to a strong vote of confidence. Looking at the overall volume picture, there is not a dynamic increase in volume. From early 2005, however, an expansion in volume can be seen. But in this current breakout from a period of high consolidation, volume has contracted. A rise in stock price with declining volume is considered a warning sign that the rise is not convincing or sustainable. |
| The relative strength index (RSI) and the stochastics both are considered toppy. The Chaikin money flow indicator is not encouraging. Buying pressure is waning just as the stock continues to rise. This could be a sign that fewer believe that further profits can be wrung out before a correction ensues. Should this spinning top mark a top, two lower targets are indicated, one being the gap at $85 and then the previous consolidation area of $82-85. A prolonged correction could eventually retest the initial breakout area of $74-75. |
Independent Canadian equities trader and technical analyst based in Peterborough
Ontario, Canada.
| Website: | www.whatsonsale.ca/financial.html |
| E-mail address: | gwg7@sympatico.ca |
Click here for more information about our publications!
Comments
Date: 03/02/05Rank: 3Comment:

Request Information From Our Sponsors
- StockCharts.com, Inc.
- Candle Patterns
- Candlestick Charting Explained
- Intermarket Technical Analysis
- John Murphy on Chart Analysis
- John Murphy's Chart Pattern Recognition
- John Murphy's Market Message
- MurphyExplainsMarketAnalysis-Intermarket Analysis
- MurphyExplainsMarketAnalysis-Visual Analysis
- StockCharts.com
- Technical Analysis of the Financial Markets
- The Visual Investor
- VectorVest, Inc.
- Executive Premier Workshop
- One-Day Options Course
- OptionsPro
- Retirement Income Workshop
- Sure-Fire Trading Systems (VectorVest, Inc.)
- Trading as a Business Workshop
- VectorVest 7 EOD
- VectorVest 7 RealTime/IntraDay
- VectorVest AutoTester
- VectorVest Educational Services
- VectorVest OnLine
- VectorVest Options Analyzer
- VectorVest ProGraphics v6.0
- VectorVest ProTrader 7
- VectorVest RealTime Derby Tool
- VectorVest Simulator
- VectorVest Variator
- VectorVest Watchdog
