HOT TOPICS LIST
- MACD
- Fibonacci
- RSI
- Gann
- ADXR
- Stochastics
- Volume
- Triangles
- Futures
- Cycles
- Volatility
- ZIGZAG
- MESA
- Retracement
- Aroon
INDICATORS LIST
LIST OF TOPICS
PRINT THIS ARTICLE
by Gary Grosschadl
Watch the NYSE for signs going forward as it is leading the way.
Position: Buy
Gary Grosschadl
Independent Canadian equities trader and technical analyst based in Peterborough
Ontario, Canada.
PRINT THIS ARTICLE
CHART ANALYSIS
NYSE Takes The Lead
02/28/05 08:31:20 AMby Gary Grosschadl
Watch the NYSE for signs going forward as it is leading the way.
Position: Buy
| The NYSE is home to some 2,800 world-class companies with a total global market value of $20 trillion as it is leading the charge north. Of the major indexes, the Dow and the Nasdaq seem to get most of the attention and the glory. But it is the NYSE that now powers higher, boldly leading the way. |
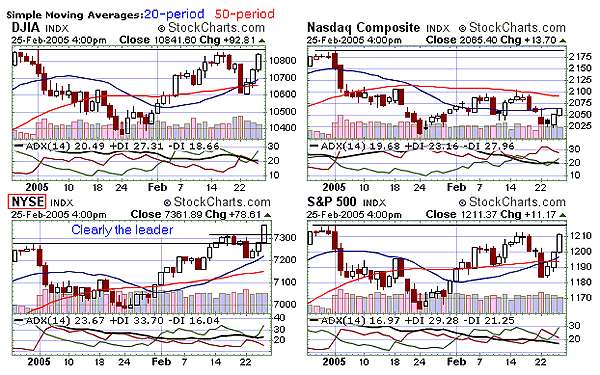
| By several measures, as these comparison charts show, this index has taken leadership since mid-February. At that point, this index broke the former high of 2004, the only index of this group to do so. With last Friday's session, it has exceeded its recent high again. Note how the pattern resembles a cup with handle breakout minus the confirming volume. This is potentially a continuation pattern, with the prior trend being the strong advance of 2004. |

|
| Figure 1: A comparison of the major averages shows NYSE leadership. |
| Graphic provided by: StockCharts.com. |
| |
| Two other indicators on these charts also show superior strength on the part of the NYSE. Note the 20-day and 50-day simple moving averages. For the NYSE, the bullish crossover of these MAs ocurred first, and note how the 20-day MA held impeccable support during this latest rise. Also shown are the average directional movement index (ADX) and directional index (DI) components on the directional movement index. The DI components never wavered from the bullish stance of +DI over -DI, indicating bullish power dominating. This current indicator shows the best promise compared to that of the others. |
| Watch this index for signs going forward as it is leading the way. Should a reversal occur, this index may lead the way again. Should this breakout be valid, look for a 300-point advance on the NYSE, as judged by the depth of the cup as applied to the breakout point as a rough measure. |
Independent Canadian equities trader and technical analyst based in Peterborough
Ontario, Canada.
| Website: | www.whatsonsale.ca/financial.html |
| E-mail address: | gwg7@sympatico.ca |
Click here for more information about our publications!
Comments
Date: 02/28/05Rank: 4Comment:
Date: 03/01/05Rank: 5Comment:

Request Information From Our Sponsors
- StockCharts.com, Inc.
- Candle Patterns
- Candlestick Charting Explained
- Intermarket Technical Analysis
- John Murphy on Chart Analysis
- John Murphy's Chart Pattern Recognition
- John Murphy's Market Message
- MurphyExplainsMarketAnalysis-Intermarket Analysis
- MurphyExplainsMarketAnalysis-Visual Analysis
- StockCharts.com
- Technical Analysis of the Financial Markets
- The Visual Investor
- VectorVest, Inc.
- Executive Premier Workshop
- One-Day Options Course
- OptionsPro
- Retirement Income Workshop
- Sure-Fire Trading Systems (VectorVest, Inc.)
- Trading as a Business Workshop
- VectorVest 7 EOD
- VectorVest 7 RealTime/IntraDay
- VectorVest AutoTester
- VectorVest Educational Services
- VectorVest OnLine
- VectorVest Options Analyzer
- VectorVest ProGraphics v6.0
- VectorVest ProTrader 7
- VectorVest RealTime Derby Tool
- VectorVest Simulator
- VectorVest Variator
- VectorVest Watchdog
