HOT TOPICS LIST
- MACD
- Fibonacci
- RSI
- Gann
- ADXR
- Stochastics
- Volume
- Triangles
- Futures
- Cycles
- Volatility
- ZIGZAG
- MESA
- Retracement
- Aroon
INDICATORS LIST
LIST OF TOPICS
PRINT THIS ARTICLE
by Koos van der Merwe
The Dow appears to have made a triple top. Does this lead to a collapse, or....?
Position: N/A
Koos van der Merwe
Has been a technical analyst since 1969, and has worked as a futures and options trader with First Financial Futures in Johannesburg, South Africa.
PRINT THIS ARTICLE
ELLIOTT WAVE
A Triple Top For The Dow?
02/28/05 03:09:59 PMby Koos van der Merwe
The Dow appears to have made a triple top. Does this lead to a collapse, or....?
Position: N/A
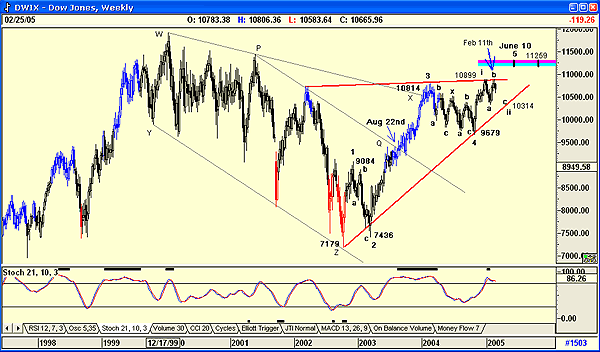
| The Dow Jones weekly looks scary, as shown in Figure 1. Triple tops are difficult to penetrate as they form a formidable resistance level. In the chart you can see quite clearly how the Dow has tried to penetrate 10899, but simply could not. If you look closely at the chart, you can see how it attempted to break through and failed once again on February 11. When you listen to all the economists talk about the Dow on CNBC and other TV programs, they are all talking the US economy down, saying, and with conviction, that a recession is waiting in the wings. The chart of the Dow shows that this is indeed possible. The question is: When? |
 Figure 1: Analyzing the chart. The trendlines Y-Z W-X show a trumpet formation, a highly unstable formation. However, the Dow soon established the resistance line P-Q parallel to Y-Z and broke above it at Q on August 22, a very positive move. This led me to attempt a wave count, as shown on the chart, with wave 3 finding resistance at 10814. Using the wave count to determine Fibonacci ratios gives nothing meaningful. Wave 2 is 87% of wave 1 and wave 3 is 177% of wave 1. We could argue that wave 3 is close enough to the Fibonacci ratio of 161.8% to be acceptable. Wave 4, on the other hand, is 60% of wave 1, not equal to the 87% of wave 2, but the a-b-c-x-a-b-c pattern that developed is very typical of a complicated wave 4 pattern when compared to the simple a-b-c pattern of wave 2. Wave 5 started off by testing the resistance level at 10899. This could be wave I of wave 5, with the a-b-c retracement possibly falling to the support line at approximately 10314. From here, it should rise to the MOB target of 11259 sometime in June 2005. The MOB target is a propriety target forecasting indicator of Advanced GET and suggests a target price for wave 5 based on the high of wave 3. Its suggestions for a time target (black lines in the indicator) are not that accurate, but does give us an approximate date. However, I do prefer using Gann fans to determine turning points (see Figure 2). |

|
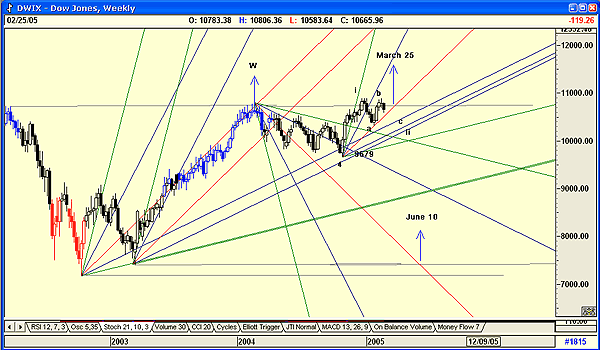
| Figure 2: The Dow and the Gann fans |
| Graphic provided by: AdvancedGET. |
| |
| The Gann fans drawn on this chart are drawn from pivot points. They suggest a possible turning point when they cross a horizontal line drawn from the previous major turning point as shown. Future dates suggested are March 25, which could be the date for the bottom of wave 4, and June 10, the possible top of wave 5. |
| Combing these two charts give me a possible target and date for the major correction anticipated for the Dow, and yes, it does look as if the economists could be correct, and that in the latter half of 2005, the Dow could move into a major bear market... correction? Let us hope that is all it is. |
Has been a technical analyst since 1969, and has worked as a futures and options trader with First Financial Futures in Johannesburg, South Africa.
| Address: | 3256 West 24th Ave |
| Vancouver, BC | |
| Phone # for sales: | 6042634214 |
| E-mail address: | petroosp@gmail.com |
Click here for more information about our publications!
Comments
Date: 02/28/05Rank: 3Comment:
Date: 03/01/05Rank: 4Comment:
Date: 03/02/05Rank: 4Comment:

Request Information From Our Sponsors
- StockCharts.com, Inc.
- Candle Patterns
- Candlestick Charting Explained
- Intermarket Technical Analysis
- John Murphy on Chart Analysis
- John Murphy's Chart Pattern Recognition
- John Murphy's Market Message
- MurphyExplainsMarketAnalysis-Intermarket Analysis
- MurphyExplainsMarketAnalysis-Visual Analysis
- StockCharts.com
- Technical Analysis of the Financial Markets
- The Visual Investor
- VectorVest, Inc.
- Executive Premier Workshop
- One-Day Options Course
- OptionsPro
- Retirement Income Workshop
- Sure-Fire Trading Systems (VectorVest, Inc.)
- Trading as a Business Workshop
- VectorVest 7 EOD
- VectorVest 7 RealTime/IntraDay
- VectorVest AutoTester
- VectorVest Educational Services
- VectorVest OnLine
- VectorVest Options Analyzer
- VectorVest ProGraphics v6.0
- VectorVest ProTrader 7
- VectorVest RealTime Derby Tool
- VectorVest Simulator
- VectorVest Variator
- VectorVest Watchdog
