HOT TOPICS LIST
- MACD
- Fibonacci
- RSI
- Gann
- ADXR
- Stochastics
- Volume
- Triangles
- Futures
- Cycles
- Volatility
- ZIGZAG
- MESA
- Retracement
- Aroon
INDICATORS LIST
LIST OF TOPICS
PRINT THIS ARTICLE
by David Penn
Once again, the bears circle Campground Apple hoping for easier pickings this time around.
Position: N/A
David Penn
Technical Writer for Technical Analysis of STOCKS & COMMODITIES magazine, Working-Money.com, and Traders.com Advantage.
PRINT THIS ARTICLE
MOVING AVERAGES
Time To Short Apple?
02/25/05 10:50:16 AMby David Penn
Once again, the bears circle Campground Apple hoping for easier pickings this time around.
Position: N/A
| Full disclosure: While I'm hardly part of the Kill Apple crowd, I will admit to salivating at the prospect of shorting Apple Computer (AAPL) months ago when none other than Jim Cramer, of Kudlow & Cramer, turned negative on the stock. |
| Since then, Cramer has reversed himself (rightly) and turned into a veritable Apple cheerleader. Nevertheless, a number of stock watchers--from the punters on websites like elitetrader.com to investment pros like Don Luskin of Trend Macrolytics--continue to stalk the iPod and cool computer maker, ready to use any fundamental or technical weakness as a signal to pounce. |

|
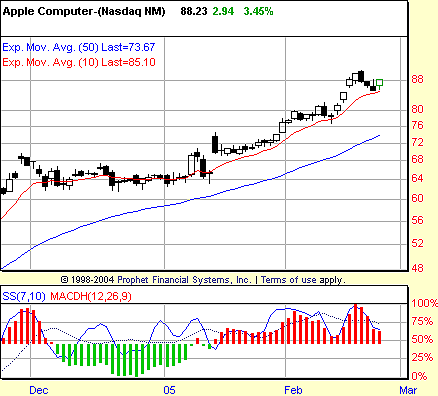
| Figure 1: Apple's year-to-date advance has been a thing of real bullish beauty. Note how the stock has resisted closing below the 10-day exponential moving average since early January. |
| Graphic provided by: Prophet Financial, Inc. |
| |
| Nothing in this chart of Apple Computer (Figure 1) screams "SHORT!" to me. While I am skeptical that Apple's success with its iPod product will continue to propel the stock higher, I really don't have a clue about the "fundamental" argument for or against AAPL. But from a technical perspective, Apple currently doesn't have any of the characteristics that would make the stock a good short. Not only is Apple trading above its 50-day exponential moving average (EMA), but also it is trading above its 10-day EMA. This suggests true trend strength--AAPL hasn't closed beneath its 10-day EMA since mid-January--during what proved to be an excellent dip to buy (more about that dip in a moment). |
| One thing that Apple is missing at this point that would encourage me to be bearish is a negative stochastic divergence. Not only is there not a negative stochastic divergence, but also the most recent negative stochastic divergence--one that occurred over the late January/early February time frame--resulted not in a reversal, but in a minor dip that actually helped set up the next buying opportunity in AAPL. |
| That opportunity arrived shortly after action in AAPL provided a sell point at about 76.15 on February 9. The low of the following day was nearly 50 cents higher, so the sell was not triggered. The day after that, however, both the stock and the moving average convergence/divergence (MACD) histogram ticked higher, which, in the context of a stock above its 50-day EMA, provided a buy point above the market, one in the neighborhood of 83.17. This buy point was reached on the following day. Two days after that, AAPL closed just north of $90. Given the three-day selloff that recently had AAPL retracing back to its 10-day EMA, a trader could be forgiven for trying to play the dip rather than force the short with the current decline. |
Technical Writer for Technical Analysis of STOCKS & COMMODITIES magazine, Working-Money.com, and Traders.com Advantage.
| Title: | Technical Writer |
| Company: | Technical Analysis, Inc. |
| Address: | 4757 California Avenue SW |
| Seattle, WA 98116 | |
| Phone # for sales: | 206 938 0570 |
| Fax: | 206 938 1307 |
| Website: | www.Traders.com |
| E-mail address: | DPenn@traders.com |
Traders' Resource Links | |
| Charting the Stock Market: The Wyckoff Method -- Books | |
| Working-Money.com -- Online Trading Services | |
| Traders.com Advantage -- Online Trading Services | |
| Technical Analysis of Stocks & Commodities -- Publications and Newsletters | |
| Working Money, at Working-Money.com -- Publications and Newsletters | |
| Traders.com Advantage -- Publications and Newsletters | |
| Professional Traders Starter Kit -- Software | |
Click here for more information about our publications!
Comments
Date: 02/26/05Rank: 3Comment:

|

Request Information From Our Sponsors
- StockCharts.com, Inc.
- Candle Patterns
- Candlestick Charting Explained
- Intermarket Technical Analysis
- John Murphy on Chart Analysis
- John Murphy's Chart Pattern Recognition
- John Murphy's Market Message
- MurphyExplainsMarketAnalysis-Intermarket Analysis
- MurphyExplainsMarketAnalysis-Visual Analysis
- StockCharts.com
- Technical Analysis of the Financial Markets
- The Visual Investor
- VectorVest, Inc.
- Executive Premier Workshop
- One-Day Options Course
- OptionsPro
- Retirement Income Workshop
- Sure-Fire Trading Systems (VectorVest, Inc.)
- Trading as a Business Workshop
- VectorVest 7 EOD
- VectorVest 7 RealTime/IntraDay
- VectorVest AutoTester
- VectorVest Educational Services
- VectorVest OnLine
- VectorVest Options Analyzer
- VectorVest ProGraphics v6.0
- VectorVest ProTrader 7
- VectorVest RealTime Derby Tool
- VectorVest Simulator
- VectorVest Variator
- VectorVest Watchdog
