HOT TOPICS LIST
- MACD
- Fibonacci
- RSI
- Gann
- ADXR
- Stochastics
- Volume
- Triangles
- Futures
- Cycles
- Volatility
- ZIGZAG
- MESA
- Retracement
- Aroon
INDICATORS LIST
LIST OF TOPICS
PRINT THIS ARTICLE
by David Penn
A negative divergence at the top of the January-February rally in the $SOX and SMH threaten further gains for this group.
Position: N/A
David Penn
Technical Writer for Technical Analysis of STOCKS & COMMODITIES magazine, Working-Money.com, and Traders.com Advantage.
PRINT THIS ARTICLE
TREND-CHANNEL
Are The Semiconductors Slip Sliding Away?
02/25/05 07:56:03 AMby David Penn
A negative divergence at the top of the January-February rally in the $SOX and SMH threaten further gains for this group.
Position: N/A
| In a recent Traders.com Advantage article, I underscored the precarious position the Nasdaq Composite was in ("The Nasdaq's No Contest," February 17, 2005). In particular, I pointed out the difficulty the index was having in moving up and away from its 10- and 50-day exponential moving averages (EMAs), as well as a "running" negative stochastic divergence and the simultaneous development of at least two shooting stars. |
| But it increasingly appears as if this weakness in the Nasdaq was telegraphed by weakness in the semiconductor group. It has long been conventional wisdom that if the Nasdaq leads the market, it is the semiconductors that lead the Nasdaq. And it seems as if the resumption of the year-to-date downtrend in the Nasdaq was no exception to this rule. |

|
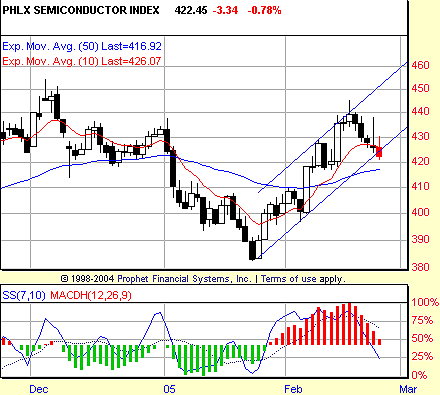
| Figure 1: After failing to close above the upper boundary of its month-long trend channel, the Philadelphia Semiconductor Index dives toward a test of the lower boundary. |
| Graphic provided by: Prophet Financial, Inc. |
| |
| For my money, the make-or-break date for the semiconductors was February 16. On that date, the $SOX (and the semiconductor HOLDRS as well) provided a sell point that, if hit, would likely lead to lower prices for semiconductor stocks. That point was reached on the following day, as the $SOX fell below about 429. And though intraday volatility on subsequent days was sufficient to drive the $SOX to just shy of 438 on February 22, the close of that day was well beneath the sell point of 429. So far, the $SOX remains below that point. |
| What are the prospects for further declines? The first task of those bearish on semiconductor stocks is to close beneath the lower boundary of the trend channel from the January lows, having secured a close beneath the 10-day EMA. Following that, a close below the 50-day EMA--which may or may not provide stiff resistance--would be the next goal for those looking for lower prices. |
| Although already oversold, what is true for markets on the way up is no less true on the way down--meaning that oversold conditions can persist in a declining market just as overbought conditions can persist in an advancing market. Note how, in January, the stochastic became very oversold early in the month, yet the $SOX was little more than halfway through its January decline. At the first stochastic low in January, the $SOX was around 405. By the time it bottomed late in the month, the $SOX was at about 385. |
Technical Writer for Technical Analysis of STOCKS & COMMODITIES magazine, Working-Money.com, and Traders.com Advantage.
| Title: | Technical Writer |
| Company: | Technical Analysis, Inc. |
| Address: | 4757 California Avenue SW |
| Seattle, WA 98116 | |
| Phone # for sales: | 206 938 0570 |
| Fax: | 206 938 1307 |
| Website: | www.Traders.com |
| E-mail address: | DPenn@traders.com |
Traders' Resource Links | |
| Charting the Stock Market: The Wyckoff Method -- Books | |
| Working-Money.com -- Online Trading Services | |
| Traders.com Advantage -- Online Trading Services | |
| Technical Analysis of Stocks & Commodities -- Publications and Newsletters | |
| Working Money, at Working-Money.com -- Publications and Newsletters | |
| Traders.com Advantage -- Publications and Newsletters | |
| Professional Traders Starter Kit -- Software | |
Click here for more information about our publications!
Comments
Date: 02/25/05Rank: 5Comment:
Date: 02/26/05Rank: 3Comment:
Date: 03/01/05Rank: 4Comment:

Request Information From Our Sponsors
- StockCharts.com, Inc.
- Candle Patterns
- Candlestick Charting Explained
- Intermarket Technical Analysis
- John Murphy on Chart Analysis
- John Murphy's Chart Pattern Recognition
- John Murphy's Market Message
- MurphyExplainsMarketAnalysis-Intermarket Analysis
- MurphyExplainsMarketAnalysis-Visual Analysis
- StockCharts.com
- Technical Analysis of the Financial Markets
- The Visual Investor
- VectorVest, Inc.
- Executive Premier Workshop
- One-Day Options Course
- OptionsPro
- Retirement Income Workshop
- Sure-Fire Trading Systems (VectorVest, Inc.)
- Trading as a Business Workshop
- VectorVest 7 EOD
- VectorVest 7 RealTime/IntraDay
- VectorVest AutoTester
- VectorVest Educational Services
- VectorVest OnLine
- VectorVest Options Analyzer
- VectorVest ProGraphics v6.0
- VectorVest ProTrader 7
- VectorVest RealTime Derby Tool
- VectorVest Simulator
- VectorVest Variator
- VectorVest Watchdog
