HOT TOPICS LIST
- MACD
- Fibonacci
- RSI
- Gann
- ADXR
- Stochastics
- Volume
- Triangles
- Futures
- Cycles
- Volatility
- ZIGZAG
- MESA
- Retracement
- Aroon
INDICATORS LIST
LIST OF TOPICS
PRINT THIS ARTICLE
by Arthur Hill
A recent trendline break and momentum downturn spell lower prices for JP Morgan Chase.
Position: Sell
Arthur Hill
Arthur Hill is currently editor of TDTrader.com, a website specializing in trading strategies, sector/industry specific breadth stats and overall technical analysis. He passed the Society of Technical Analysts (STA London) diploma exam with distinction is a Certified Financial Technician (CFTe). Prior to TD Trader, he was the Chief Technical Analyst for Stockcharts.com and the main contributor to the ChartSchool.
PRINT THIS ARTICLE
TRIANGLES
JP Morgan Chase Drags Finance Lower
02/24/05 08:24:56 AMby Arthur Hill
A recent trendline break and momentum downturn spell lower prices for JP Morgan Chase.
Position: Sell
| As one of the top money center banks, JP Morgan Chase (JPM) features prominently in the finance sector. The finance sector is the single largest sector in the Standard & Poor's 500 and makes up around 20% of the index. Weakness in JP Morgan bodes ill for the finance sector, and by extension, this will weigh on the S&P 500. Even though the index can certainly advance without help from its top sector, it would be most difficult. |
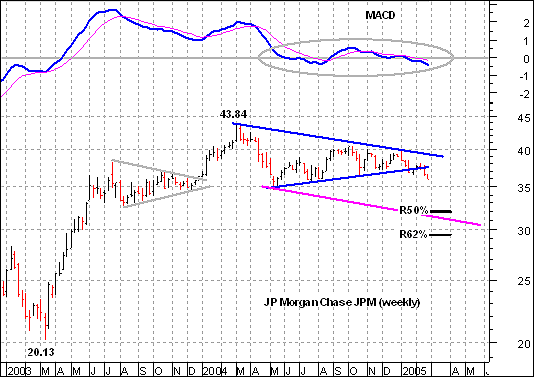
| On the weekly price chart, JPM had a great run in 2003 and more than doubled from 20.13 to 43.84. Last year, 2004, was not as kind, as the stock declined in the first quarter and then consolidated the next three. The resulting pattern is a large triangle (blue trendlines), which is a neutral pattern that is resolved with a trendline break. |

|
| Figure 1: JP Morgan Chase. JPM had a great run in 2003 and more than doubled from 20.13 to 43.84. Last year, 2004, was not as kind, as the stock declined in the first quarter and then consolidated the next three. |
| Graphic provided by: MetaStock. |
| Graphic provided by: Reuters Data. |
| |
| With a break below the lower trendline this month, the pattern has been resolved in favor of the bears and further weakness to the low 30s is expected. Two techniques were used for this target. First, the triangle target is found by drawing a trendline parallel to the upper trendline. This (magenta) trendline extends to 30-31 over the next few months. The other method was with a retracement. After a sharp advance, a 50-62% retracement is normal and this targets a decline to around 30-32. |
| Not to be left out, the moving average convergence/divergence (MACD) confirms the recent trendline break with a move into negative territory. This is the second foray into negative territory over the last few months. Note that momentum turned flat as the triangle unfolded (gray oval). With the move into negative territory, momentum is now clearly bearish and supports lower prices. |
Arthur Hill is currently editor of TDTrader.com, a website specializing in trading strategies, sector/industry specific breadth stats and overall technical analysis. He passed the Society of Technical Analysts (STA London) diploma exam with distinction is a Certified Financial Technician (CFTe). Prior to TD Trader, he was the Chief Technical Analyst for Stockcharts.com and the main contributor to the ChartSchool.
| Title: | Editor |
| Company: | TDTrader.com |
| Address: | Willem Geetsstraat 17 |
| Mechelen, B2800 | |
| Phone # for sales: | 3215345465 |
| Website: | www.tdtrader.com |
| E-mail address: | arthurh@tdtrader.com |
Traders' Resource Links | |
| TDTrader.com has not added any product or service information to TRADERS' RESOURCE. | |
Click here for more information about our publications!
Comments
Date: 02/24/05Rank: 4Comment:

Request Information From Our Sponsors
- VectorVest, Inc.
- Executive Premier Workshop
- One-Day Options Course
- OptionsPro
- Retirement Income Workshop
- Sure-Fire Trading Systems (VectorVest, Inc.)
- Trading as a Business Workshop
- VectorVest 7 EOD
- VectorVest 7 RealTime/IntraDay
- VectorVest AutoTester
- VectorVest Educational Services
- VectorVest OnLine
- VectorVest Options Analyzer
- VectorVest ProGraphics v6.0
- VectorVest ProTrader 7
- VectorVest RealTime Derby Tool
- VectorVest Simulator
- VectorVest Variator
- VectorVest Watchdog
- StockCharts.com, Inc.
- Candle Patterns
- Candlestick Charting Explained
- Intermarket Technical Analysis
- John Murphy on Chart Analysis
- John Murphy's Chart Pattern Recognition
- John Murphy's Market Message
- MurphyExplainsMarketAnalysis-Intermarket Analysis
- MurphyExplainsMarketAnalysis-Visual Analysis
- StockCharts.com
- Technical Analysis of the Financial Markets
- The Visual Investor
