

HOT TOPICS LIST
- MACD
- Fibonacci
- RSI
- Gann
- ADXR
- Stochastics
- Volume
- Triangles
- Futures
- Cycles
- Volatility
- ZIGZAG
- MESA
- Retracement
- Aroon
INDICATORS LIST
LIST OF TOPICS
PRINT THIS ARTICLE
by Dr. Dennis Ridley
Wouldn't it be nice to be able to accurately forecast stock price activity? Realistically, if that were possible, financial markets wouldn't exist.
Position: N/A
Dr. Dennis Ridley
Operations Research & Statistics Professor.
Consultant on time series analysis and forecasting.
PRINT THIS ARTICLE
Forecasting The Financial Market
06/21/00 11:32:00 AMby Dr. Dennis Ridley
Wouldn't it be nice to be able to accurately forecast stock price activity? Realistically, if that were possible, financial markets wouldn't exist.
Position: N/A
| The uncertainty of price movement is the driving force behind the stock market and it is your responsibility to do the best you can in forecasting upcoming changes. If you study a historical chart of any broad index you will notice that prices follow cyclical patterns. Cycles are wave patterns displaying peaks and troughs. Sharp increases and decreases in price occur when the underlying cycles are in phase (come together) and end when they cancel. |
| I have studied cycles extensively by using statistical forecasting techniques. Historical prices contain several cycles. One method of forecasting data using cycles is the moving window spectral (mws) method, the details of which can be found on my website, www.fourcast.net. Historical prices are assumed to contain cyclical components that change systematically and predictably. I used a computer to fit a mathematical model to the systematic component of price history, taking into account all cycles. But there is also a component that is random - unexplainable and unpredictable - that the model does not accommodate. These would cause some error in the results. |
|
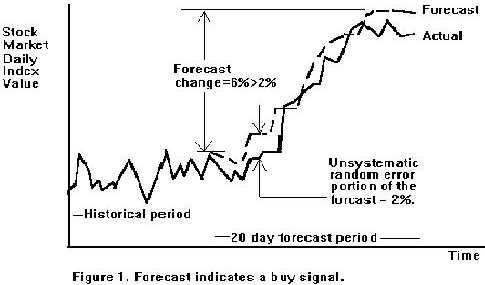
| Figure 1. Forecast change=6%>2% indicates a buy signal. |
| |
| To accommodate for this error I quantified the random component. For example, suppose I assign 2% as the random error to forecast price activity for the Dow Jones Industrial Average (DJIA). There are two possible outcomes: 1. The forecast could change by less than 2%. 2. The forecast could rise by 2% . If the forecast changes by less than 2% it indicates no systematic change, and is neither a buy or sell signal. The chart above displays the second outcome. The forecast increased by more than 2% consistently for 20 days. This suggests that there is systematic change and may be interpreted as a buy signal. Conversely, if the market forecast fell by more than 2% consistently for 20 days, it may be interpreted as a sell signal. These numbers may be used as a guide for developing a personal strategy. |
| This strategy does not take into account the effect of regulatory intervention which can have an influence on interest rates. A self-evaluation review test on how to apply forecasting to the financial markets is available at www.fourcast.net. |
Operations Research & Statistics Professor.
Consultant on time series analysis and forecasting.
| Title: | Vice President |
| Company: | Engineering Management Consultants |
| Address: | P.O.Box 12518 |
| Tallahassee, FL 32317-2518 | |
| Phone # for sales: | (850)668-0635 |
| Fax: | (850)668-5937 |
| Website: | www.fourcast.net |
| E-mail address: | fourcast@polaris.net |
Traders' Resource Links | |
| FOURCAST -- Software | |
Click here for more information about our publications!
Comments

Request Information From Our Sponsors
- StockCharts.com, Inc.
- Candle Patterns
- Candlestick Charting Explained
- Intermarket Technical Analysis
- John Murphy on Chart Analysis
- John Murphy's Chart Pattern Recognition
- John Murphy's Market Message
- MurphyExplainsMarketAnalysis-Intermarket Analysis
- MurphyExplainsMarketAnalysis-Visual Analysis
- StockCharts.com
- Technical Analysis of the Financial Markets
- The Visual Investor
- VectorVest, Inc.
- Executive Premier Workshop
- One-Day Options Course
- OptionsPro
- Retirement Income Workshop
- Sure-Fire Trading Systems (VectorVest, Inc.)
- Trading as a Business Workshop
- VectorVest 7 EOD
- VectorVest 7 RealTime/IntraDay
- VectorVest AutoTester
- VectorVest Educational Services
- VectorVest OnLine
- VectorVest Options Analyzer
- VectorVest ProGraphics v6.0
- VectorVest ProTrader 7
- VectorVest RealTime Derby Tool
- VectorVest Simulator
- VectorVest Variator
- VectorVest Watchdog