HOT TOPICS LIST
- MACD
- Fibonacci
- RSI
- Gann
- ADXR
- Stochastics
- Volume
- Triangles
- Futures
- Cycles
- Volatility
- ZIGZAG
- MESA
- Retracement
- Aroon
INDICATORS LIST
LIST OF TOPICS
PRINT THIS ARTICLE
by Kevin Hopson
Further price weakness in the near term could create an excellent buying opportunity for this stock.
Position: N/A
Kevin Hopson
Kevin has been a technical analyst for roughly 10 years now. Previously, Kevin owned his own business and acted as a registered investment advisor, specializing in energy. He was also a freelance oil analyst for Orient Trading Co., a commodity futures trading firm in Japan. Kevin is currently a freelance writer.
PRINT THIS ARTICLE
TECHNICAL ANALYSIS
Duke Energy Pulling Back To Key Support
02/23/05 10:57:24 AMby Kevin Hopson
Further price weakness in the near term could create an excellent buying opportunity for this stock.
Position: N/A
| Duke Energy Corp. (DUK), like many other utility companies, pulled back last Friday as a jump in the producer price index (PPI) renewed fears of further interest rate hikes. Because utility companies are debt-laden, prices of these stocks tend to move in the opposite direction of interest rates. However, the market has been trying to predict a top in these stocks for several months now, as evident by the extremely high short interest ratio for the group. In particular, short interest for Duke was 17,800,000 shares as of January 10, which equates to a short interest ratio of roughly 6.2x. In addition, 21 of the 27 analysts that cover the company currently have a hold or sell rating on the stock. As a result, there is a lot of potential buying pressure to push the stock higher. |
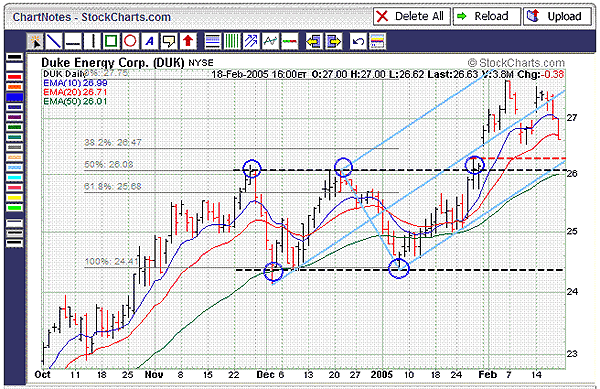
| Technically speaking, Duke recently broke out of a two-month trading range formation, as illustrated by the dotted black lines. This breakout indicates a possible upside target of between $29.50 and $31.20. I calculated this by taking the number of times that prices tested the top channel line before breaking out (three), multiplying this by the width of the trading range ($26.10-$24.40=$1.70), and then adding this figure ($1.70x3=$5.10) to the bottom ($24.40+$5.10=$29.50) and top ($26.10+$5.10=$31.20) channel lines. |

|
| Figure 1: Duke Energy. Note that prices recently closed below the 20-day exponential moving average (EMA) ($26.71). If the selling pressure continues and the stock proceeds to pull back to the $26.00 to $26.30 range, it could create an excellent buying opportunity. |
| Graphic provided by: StockCharts.com. |
| |
| If you look at the chart, you will note that prices recently closed below the 20-day exponential moving average (EMA) ($26.71). If the selling pressure continues and the stock proceeds to pull back to the $26.00 to $26.30 range, it could create an excellent buying opportunity. I say this because there is a significant confluence of support here. More specifically, the stock's 50-day EMA ($26.01) and the 50% retracement level ($26.08) from the January to February rally both come into play here. In addition, this is the site of January's unfilled gap (dotted red line), the top of the prior trading range, and the bottom parallel line of the blue pitchfork (January's uptrend line). Given the overly pessimistic market sentiment, recent trading range breakout and key support at slightly lower levels, Duke Energy could be setting up for another move higher. |
Kevin has been a technical analyst for roughly 10 years now. Previously, Kevin owned his own business and acted as a registered investment advisor, specializing in energy. He was also a freelance oil analyst for Orient Trading Co., a commodity futures trading firm in Japan. Kevin is currently a freelance writer.
| Glen Allen, VA | |
| E-mail address: | hopson_1@yahoo.com |
Click here for more information about our publications!
Comments
Date: 02/23/05Rank: 4Comment:

Request Information From Our Sponsors
- VectorVest, Inc.
- Executive Premier Workshop
- One-Day Options Course
- OptionsPro
- Retirement Income Workshop
- Sure-Fire Trading Systems (VectorVest, Inc.)
- Trading as a Business Workshop
- VectorVest 7 EOD
- VectorVest 7 RealTime/IntraDay
- VectorVest AutoTester
- VectorVest Educational Services
- VectorVest OnLine
- VectorVest Options Analyzer
- VectorVest ProGraphics v6.0
- VectorVest ProTrader 7
- VectorVest RealTime Derby Tool
- VectorVest Simulator
- VectorVest Variator
- VectorVest Watchdog
- StockCharts.com, Inc.
- Candle Patterns
- Candlestick Charting Explained
- Intermarket Technical Analysis
- John Murphy on Chart Analysis
- John Murphy's Chart Pattern Recognition
- John Murphy's Market Message
- MurphyExplainsMarketAnalysis-Intermarket Analysis
- MurphyExplainsMarketAnalysis-Visual Analysis
- StockCharts.com
- Technical Analysis of the Financial Markets
- The Visual Investor
