HOT TOPICS LIST
- MACD
- Fibonacci
- RSI
- Gann
- ADXR
- Stochastics
- Volume
- Triangles
- Futures
- Cycles
- Volatility
- ZIGZAG
- MESA
- Retracement
- Aroon
INDICATORS LIST
LIST OF TOPICS
PRINT THIS ARTICLE
by Gary Grosschadl
This stock is ready for a bounce, how far can it go?
Position: Buy
Gary Grosschadl
Independent Canadian equities trader and technical analyst based in Peterborough
Ontario, Canada.
PRINT THIS ARTICLE
CHART ANALYSIS
Millennium Pharmaceuticals Moves Off A Bottom
02/23/05 08:07:34 AMby Gary Grosschadl
This stock is ready for a bounce, how far can it go?
Position: Buy
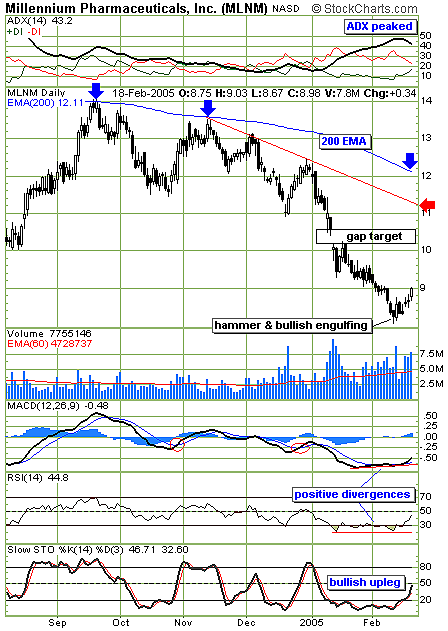
| Since this pharmaceutical stock twice failed at overhead 200-day exponential moving average (EMA) resistance, a downtrend dominated. Now it finally looks as if a bounce is under way with a recognizable candlestick pattern. A week ago, a hammer candlestick was followed by a bullish engulfing signal. This combination after a long downleg is often a reliable turnaround pattern, and those traders who hopped onboard early are already in a profitable position. |
| Several indicators point to an upleg under way. The average directional movement index (ADX) has peaked, while the DI indicators are converging to possibly try a bullish cross. This indicates a bullish trend change under way as the previous trend is "overheated" by virtue of the peaked ADX. Should the DIs cross, power shifts from the bears to the bulls. |

|
| Figure 1: Millennium Pharmaceuticals. The daily chart shows a bottom bounce attempt with several upside targets. |
| Graphic provided by: StockCharts.com. |
| |
| The lower indicators also show bullish promise. The moving average convergence/divergence (MACD) has done a bullish cross above its (blue) signal line and is showing a bullish divergence to recent price action. A similar bullish divergence is also shown via the relative strength index (RSI). When the stock price makes a lower low and several indicators do not follow suit, a bullish upswing in price often follows. The stochastics indicator also reflects this bullish upswing as it finally breaks above its 20 level. |
| Three upside targets are considered on this daily chart. The first is a previous gap area, approximately $10.20-10.60. Previous gaps are considered to be potentially significant areas of future support or (in this case) resistance. Should the rise pause and regroup at this level, two higher targets are indicated at a trendline, and then the often formidable 200-day EMA. Note how two previous uplegs were turned back at the trendline. |
| In summary, a tradable bounce is likely under way. Short-term traders will likely target the previous gap as a prudent area to take quick profits. Should the stock successfully consolidate and eventually forge higher, the next two target areas come into play. |
Independent Canadian equities trader and technical analyst based in Peterborough
Ontario, Canada.
| Website: | www.whatsonsale.ca/financial.html |
| E-mail address: | gwg7@sympatico.ca |
Click here for more information about our publications!
Comments
Date: 02/23/05Rank: 5Comment:

Request Information From Our Sponsors
- VectorVest, Inc.
- Executive Premier Workshop
- One-Day Options Course
- OptionsPro
- Retirement Income Workshop
- Sure-Fire Trading Systems (VectorVest, Inc.)
- Trading as a Business Workshop
- VectorVest 7 EOD
- VectorVest 7 RealTime/IntraDay
- VectorVest AutoTester
- VectorVest Educational Services
- VectorVest OnLine
- VectorVest Options Analyzer
- VectorVest ProGraphics v6.0
- VectorVest ProTrader 7
- VectorVest RealTime Derby Tool
- VectorVest Simulator
- VectorVest Variator
- VectorVest Watchdog
- StockCharts.com, Inc.
- Candle Patterns
- Candlestick Charting Explained
- Intermarket Technical Analysis
- John Murphy on Chart Analysis
- John Murphy's Chart Pattern Recognition
- John Murphy's Market Message
- MurphyExplainsMarketAnalysis-Intermarket Analysis
- MurphyExplainsMarketAnalysis-Visual Analysis
- StockCharts.com
- Technical Analysis of the Financial Markets
- The Visual Investor
