

HOT TOPICS LIST
- MACD
- Fibonacci
- RSI
- Gann
- ADXR
- Stochastics
- Volume
- Triangles
- Futures
- Cycles
- Volatility
- ZIGZAG
- MESA
- Retracement
- Aroon
INDICATORS LIST
LIST OF TOPICS
PRINT THIS ARTICLE
by Kevin Hopson
Recent uncertainty has given way to higher prices for FuelCell Energy.
Position: N/A
Kevin Hopson
Kevin has been a technical analyst for roughly 10 years now. Previously, Kevin owned his own business and acted as a registered investment advisor, specializing in energy. He was also a freelance oil analyst for Orient Trading Co., a commodity futures trading firm in Japan. Kevin is currently a freelance writer.
PRINT THIS ARTICLE
ANDREWS PITCH-FORK
Possible Upside Targets For FuelCell Energy
02/18/05 08:15:24 AMby Kevin Hopson
Recent uncertainty has given way to higher prices for FuelCell Energy.
Position: N/A
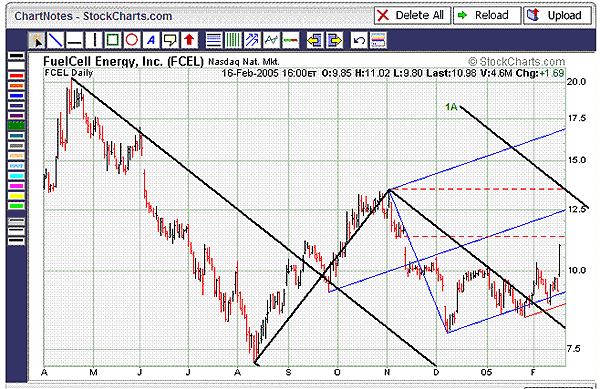
| FuelCell Energy (FCEL) was showing mixed signals in January, but things have recently changed for the better. For example, note how the top parallel line of the black pitchfork (last November's downtrend line) turned back prices several times in January. On the flip side, the bottom parallel line of the blue pitchfork was acting as support during this time. What is strange about these two pitchforks is that each was showing something different. |
| If you have read my articles before, you are probably aware of the "price failure" rule. This occurs when prices fail to test the median line of a pitchfork prior to testing the top or bottom parallel line. When prices test the top parallel line without testing the median line, it is a sign of strength. When prices test the bottom parallel line without testing the median line, it is a sign of weakness. As you can see in Figure 1, both of these scenarios played out -- one with the black pitchfork (sign of strength) and the other with the blue pitchfork (sign of weakness). |
|
| Figure 1: FuelCell Energy. January's breach of the lower blue parallel line in FCEL may have fooled some people into thinking that a breakdown was imminent. |
| Graphic provided by: StockCharts.com. |
| |
| January's breach of the lower blue parallel line may have fooled some people into thinking that a breakdown was imminent. However, if you remember, I like to draw a sliding parallel (or warning) line from the low to give prices the benefit of the doubt. As you can see, this red trendline held. When prices overcame November's downtrend line in late January and remained above the warning line during the ensuing correction, an upside breakout was confirmed. |
| Now that prices have broken out, there are a few potential upside targets to keep your eye on. The first target is the $11.40 level, which is the site of last November's unfilled gap and the 61.8% retracement from the November-December decline. If this resistance level is taken out, $12.50 (blue median line) would be the next upside target. A move above this level and $13.50 could come into play. This is the site of last November's high and the 1A channel line. |
Kevin has been a technical analyst for roughly 10 years now. Previously, Kevin owned his own business and acted as a registered investment advisor, specializing in energy. He was also a freelance oil analyst for Orient Trading Co., a commodity futures trading firm in Japan. Kevin is currently a freelance writer.
| Glen Allen, VA | |
| E-mail address: | hopson_1@yahoo.com |
Click here for more information about our publications!
Comments
Date:�02/22/05Rank:�4Comment:�
Date:�02/23/05Rank:�3Comment:�

Request Information From Our Sponsors
- StockCharts.com, Inc.
- Candle Patterns
- Candlestick Charting Explained
- Intermarket Technical Analysis
- John Murphy on Chart Analysis
- John Murphy's Chart Pattern Recognition
- John Murphy's Market Message
- MurphyExplainsMarketAnalysis-Intermarket Analysis
- MurphyExplainsMarketAnalysis-Visual Analysis
- StockCharts.com
- Technical Analysis of the Financial Markets
- The Visual Investor
- VectorVest, Inc.
- Executive Premier Workshop
- One-Day Options Course
- OptionsPro
- Retirement Income Workshop
- Sure-Fire Trading Systems (VectorVest, Inc.)
- Trading as a Business Workshop
- VectorVest 7 EOD
- VectorVest 7 RealTime/IntraDay
- VectorVest AutoTester
- VectorVest Educational Services
- VectorVest OnLine
- VectorVest Options Analyzer
- VectorVest ProGraphics v6.0
- VectorVest ProTrader 7
- VectorVest RealTime Derby Tool
- VectorVest Simulator
- VectorVest Variator
- VectorVest Watchdog