HOT TOPICS LIST
- MACD
- Fibonacci
- RSI
- Gann
- ADXR
- Stochastics
- Volume
- Triangles
- Futures
- Cycles
- Volatility
- ZIGZAG
- MESA
- Retracement
- Aroon
INDICATORS LIST
LIST OF TOPICS
PRINT THIS ARTICLE
by David Penn
Measuring the progress of the yellow metal's first-quarter bounce.
Position: N/A
David Penn
Technical Writer for Technical Analysis of STOCKS & COMMODITIES magazine, Working-Money.com, and Traders.com Advantage.
PRINT THIS ARTICLE
FIBONACCI
April (Fool's) Gold
02/16/05 11:23:23 AMby David Penn
Measuring the progress of the yellow metal's first-quarter bounce.
Position: N/A
| Most of what I know about Fibonacci retracements I know from the world of Elliott wave theory. But I have been trying to pay more attention to these retracements in and of themselves when looking to measure the might of bounces, pullbacks, springs, and dips. |
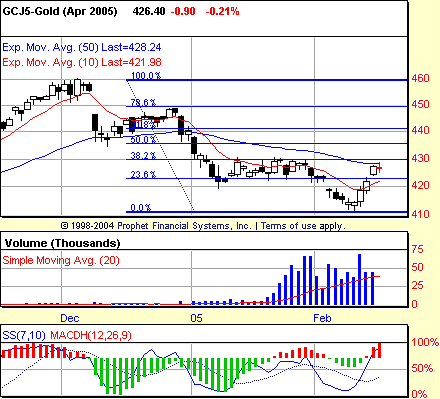
| The most recent bounce or spring that I've tried to understand by way of Fibonacci retracements is the mid-February move in April gold. Gold bugs, as I suggested in a recent Traders.com Advantage article ("Down Goes the Dollar?"), have been waiting for renewed weakness in the greenback as a signal to go long gold ever since gold began plummeting in December 2004. As such, the February bounce in gold has been quite the Valentine's Day gift for that cohort of gold bulls. |

|
| Figure 1: Gold. The February bounce in April gold sees prices heading toward potential resistance at the 38.2% retracement level. This level also coincides with the 50-day exponential moving average. |
| Graphic provided by: Prophet Financial, Inc. |
| |
| Will this gift continue to keep giving? Or like Valentine's Day roses, will the rally in gold only make it for a week or two after the holiday? Volume, basis April, has started to trail off somewhat in the days since April gold first showed signs of life near the $410. But the first significant challenge to gold's bounce comes as prices approach the 38.2% Fibonacci retracement level--a level that just happens to coincide with the 50-day exponential moving average (EMA). While there is no guarantee that gold will find resistance at this level, it does represent the first potential "stopping point" in this very early advance. Powering through this level on strong volume, for instance, would be a major boon for gold bulls, perhaps even forcing those who had profited (and were still profiting) from gold's decline to abandon their selling or even to switch sides. |
| Not only is there resistance based on the 38.2% Fibonacci retracement level and the 50-day EMA, but also the top of the consolidation range that characterized April gold for much of January will likely provide a hurdle of some degree. All three of these potential obstacles to a continued advance loom before the bounce in gold, and all three will need to be dealt with before the bulls will record any meaningful gains in gold. |
| Five up days in a row coming off the February lows, it wouldn't be surprising if April gold pulled back some--even if further gains are what's in store. This should put a little pause in sellers of gold who might be fooled into thinking that the bear market was back in force should gold make a sudden pullback toward $420. In the event of a pullback, it would be worth watching to see how well the gap up from Valentine's Day holds. |
Technical Writer for Technical Analysis of STOCKS & COMMODITIES magazine, Working-Money.com, and Traders.com Advantage.
| Title: | Technical Writer |
| Company: | Technical Analysis, Inc. |
| Address: | 4757 California Avenue SW |
| Seattle, WA 98116 | |
| Phone # for sales: | 206 938 0570 |
| Fax: | 206 938 1307 |
| Website: | www.Traders.com |
| E-mail address: | DPenn@traders.com |
Traders' Resource Links | |
| Charting the Stock Market: The Wyckoff Method -- Books | |
| Working-Money.com -- Online Trading Services | |
| Traders.com Advantage -- Online Trading Services | |
| Technical Analysis of Stocks & Commodities -- Publications and Newsletters | |
| Working Money, at Working-Money.com -- Publications and Newsletters | |
| Traders.com Advantage -- Publications and Newsletters | |
| Professional Traders Starter Kit -- Software | |
Click here for more information about our publications!
Comments
Date: 02/16/05Rank: 3Comment:
Date: 02/22/05Rank: 5Comment:

Request Information From Our Sponsors
- StockCharts.com, Inc.
- Candle Patterns
- Candlestick Charting Explained
- Intermarket Technical Analysis
- John Murphy on Chart Analysis
- John Murphy's Chart Pattern Recognition
- John Murphy's Market Message
- MurphyExplainsMarketAnalysis-Intermarket Analysis
- MurphyExplainsMarketAnalysis-Visual Analysis
- StockCharts.com
- Technical Analysis of the Financial Markets
- The Visual Investor
- VectorVest, Inc.
- Executive Premier Workshop
- One-Day Options Course
- OptionsPro
- Retirement Income Workshop
- Sure-Fire Trading Systems (VectorVest, Inc.)
- Trading as a Business Workshop
- VectorVest 7 EOD
- VectorVest 7 RealTime/IntraDay
- VectorVest AutoTester
- VectorVest Educational Services
- VectorVest OnLine
- VectorVest Options Analyzer
- VectorVest ProGraphics v6.0
- VectorVest ProTrader 7
- VectorVest RealTime Derby Tool
- VectorVest Simulator
- VectorVest Variator
- VectorVest Watchdog
