HOT TOPICS LIST
- MACD
- Fibonacci
- RSI
- Gann
- ADXR
- Stochastics
- Volume
- Triangles
- Futures
- Cycles
- Volatility
- ZIGZAG
- MESA
- Retracement
- Aroon
INDICATORS LIST
LIST OF TOPICS
PRINT THIS ARTICLE
by Kevin Hopson
Tesoro Petroleum is still stuck in a trading range, which could be good news for those traders who have yet to go long.
Position: N/A
Kevin Hopson
Kevin has been a technical analyst for roughly 10 years now. Previously, Kevin owned his own business and acted as a registered investment advisor, specializing in energy. He was also a freelance oil analyst for Orient Trading Co., a commodity futures trading firm in Japan. Kevin is currently a freelance writer.
PRINT THIS ARTICLE
TECHNICAL ANALYSIS
Tesoro's Trading Range Still Intact
02/14/05 08:24:08 AMby Kevin Hopson
Tesoro Petroleum is still stuck in a trading range, which could be good news for those traders who have yet to go long.
Position: N/A
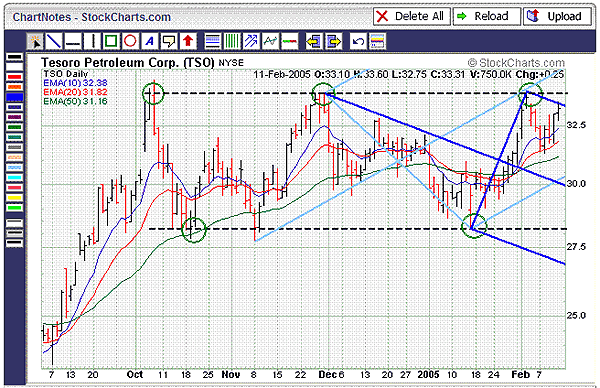
| I touched on Tesoro Petroleum (TSO) in December 2004. At that time, I mentioned how the stock was stuck in a trading range between the $28.00 and $34.00 levels. As you can see in the five-month chart, not much has changed over the last several weeks. While other refining stocks -- like Valero Energy (VLO) and Frontier Oil (FTO) -- have been breaking out to new 52-week highs, Tesoro has failed to do so. Though this could be due to weaker fundamentals than the rest of the group, Tesoro's bullish trading range still points to higher prices for the stock. |
| More specifically, if Tesoro can overcome key resistance in the $34.00 to $34.50 range, the stock could eventually make its way up to the $45.50 to $51.25 range. I calculated this target by taking the number of times that the stock has tested the top channel line in alternate sequence (3), multiplying this number by the width of the trading range ($34.00-$28.25=$5.75) and then adding this figure ($5.75*3=$17.25) to the bottom ($28.25+$17.25=$45.50) and top ($34.00+$17.25=$51.25) channel lines. This price target assumes that Tesoro will break the top channel line without testing the bottom channel line again. |

|
| Figure 1: Tesoro. In addition to the bullish technicals, Tesoro looks good from a sentiment standpoint as well. |
| Graphic provided by: StockCharts.com. |
| |
| In addition to the bullish technicals, Tesoro looks good from a sentiment standpoint as well. For example, short interest for the stock was 3.2 million shares as of January 10, which equals a short interest ratio (SIR) of roughly 3.2x. An SIR above 3.0x is considered bullish, as there is a sizable amount of potential buying pressure to push prices higher. Meanwhile, 10 of the 18 analysts covering the company currently have a hold or sell rating on Tesoro. Further, from the start of the trading range until now, Tesoro's put/call open interest ratio has been steadily rising. More specifically, this ratio has gone from 0.76 in late October to 0.96 as of last Friday (February 11, 2005). |
| Though the stock recently met resistance around the $34.00 level, which is the site of the light blue median line and the top channel line, Tesoro is showing signs of strength. For example, note how prices are bumping up against the top parallel line ($33.50) of the dark blue pitchfork right now. However, prices failed to test the median line prior to this. This is known as the "price failure" rule -- a sign of strength in this case -- and should eventually lead to a break of resistance along the top parallel line. If so, it would clear the way for another test of the top channel line and a potential breakout in the near term. Given the positive technical picture and building pessimism toward the company, I continue to be optimistic on shares of Tesoro Petroleum. |
Kevin has been a technical analyst for roughly 10 years now. Previously, Kevin owned his own business and acted as a registered investment advisor, specializing in energy. He was also a freelance oil analyst for Orient Trading Co., a commodity futures trading firm in Japan. Kevin is currently a freelance writer.
| Glen Allen, VA | |
| E-mail address: | hopson_1@yahoo.com |
Click here for more information about our publications!
Comments
Date: 02/14/05Rank: 4Comment:
Date: 02/15/05Rank: 5Comment:

Request Information From Our Sponsors
- VectorVest, Inc.
- Executive Premier Workshop
- One-Day Options Course
- OptionsPro
- Retirement Income Workshop
- Sure-Fire Trading Systems (VectorVest, Inc.)
- Trading as a Business Workshop
- VectorVest 7 EOD
- VectorVest 7 RealTime/IntraDay
- VectorVest AutoTester
- VectorVest Educational Services
- VectorVest OnLine
- VectorVest Options Analyzer
- VectorVest ProGraphics v6.0
- VectorVest ProTrader 7
- VectorVest RealTime Derby Tool
- VectorVest Simulator
- VectorVest Variator
- VectorVest Watchdog
- StockCharts.com, Inc.
- Candle Patterns
- Candlestick Charting Explained
- Intermarket Technical Analysis
- John Murphy on Chart Analysis
- John Murphy's Chart Pattern Recognition
- John Murphy's Market Message
- MurphyExplainsMarketAnalysis-Intermarket Analysis
- MurphyExplainsMarketAnalysis-Visual Analysis
- StockCharts.com
- Technical Analysis of the Financial Markets
- The Visual Investor
