HOT TOPICS LIST
- MACD
- Fibonacci
- RSI
- Gann
- ADXR
- Stochastics
- Volume
- Triangles
- Futures
- Cycles
- Volatility
- ZIGZAG
- MESA
- Retracement
- Aroon
INDICATORS LIST
LIST OF TOPICS
PRINT THIS ARTICLE
by Gary Grosschadl
This Fortune 100 global communications leader had a head-turning ride up the charts in the past two years, doubling in price. Now it looks topped out.
Position: Sell
Gary Grosschadl
Independent Canadian equities trader and technical analyst based in Peterborough
Ontario, Canada.
PRINT THIS ARTICLE
DOUBLE TOPS
Motorola Losing Charge
02/11/05 08:46:46 AMby Gary Grosschadl
This Fortune 100 global communications leader had a head-turning ride up the charts in the past two years, doubling in price. Now it looks topped out.
Position: Sell
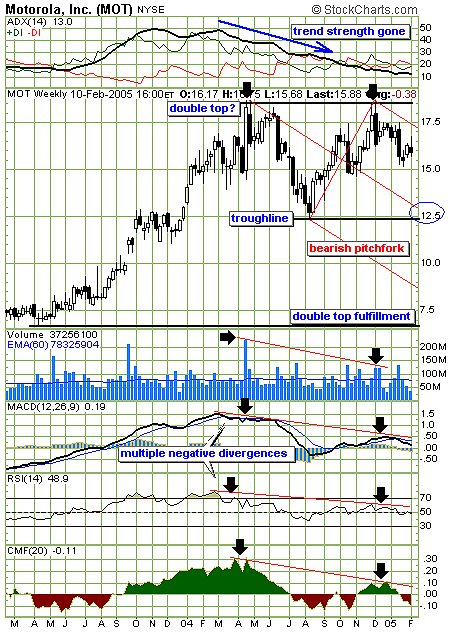
| This weekly chart suggests two pattern formations to consider, both pointing to downside implications. A double-top test may be forming. A true double top occurs only when the troughline is violated to the downside. Until that happens, it is only a possible double top. Aggressive traders may decide to trade the formation as a double-top test, with a downside target being the troughline. Although it seems unlikely, should the double-top formation complete to its fullfilment target, this would bring it to former lows near $7. This is the distance from the top of the formation to the troughline, applied below the troughline. |
| The second pattern on the chart is an Andrews pitchfork. Using three significant turning points, the charting software plots the pitchfork so that lines of support and resistance are drawn. This downward facing pitchfork has two targets, the first being the median line, which seems to agree with the $12.50 area of the troughline. A super bear move could take it to the lower pitchfork line, also referred to as the lower median line. Should the stock head back up and close above the upper median line, the current pitchfork would no longer be valid and all bearish bets would be off. |

|
| Figure 1: MOT. Motorola's weekly chart suggests a downside push to the $12.50 area. |
| Graphic provided by: StockCharts.com. |
| |
| Several indicators are worth noting. The average directional movement index (ADX) is a measure of trend strength. Here, it shows how the trend strength has plunged and dissipated. The previous bullish trend is clearly over. For a serious downleg to develop, the ADX would have to reverse and head back up. The lower indicators (including volume) all show a negative divergence to the topping action at the second top. This points to a downleg developing, but how far down it goes remains to be seen. Currently, all three indicators are still bearish. The moving average convergence/divergence (MACD) recently did a bearish cross, the relative strength index (RSI) is now under the important 50 level, and the Chaikin money flow (CMF) indicator is in negative territory. |
| Traders should be alert for any strong bounce possibility at or near the downside target levels, especially near the $12.50 level, as many traders will anticipate some support there. |
Independent Canadian equities trader and technical analyst based in Peterborough
Ontario, Canada.
| Website: | www.whatsonsale.ca/financial.html |
| E-mail address: | gwg7@sympatico.ca |
Click here for more information about our publications!
Comments
Date: 02/11/05Rank: 5Comment:

|

Request Information From Our Sponsors
- StockCharts.com, Inc.
- Candle Patterns
- Candlestick Charting Explained
- Intermarket Technical Analysis
- John Murphy on Chart Analysis
- John Murphy's Chart Pattern Recognition
- John Murphy's Market Message
- MurphyExplainsMarketAnalysis-Intermarket Analysis
- MurphyExplainsMarketAnalysis-Visual Analysis
- StockCharts.com
- Technical Analysis of the Financial Markets
- The Visual Investor
- VectorVest, Inc.
- Executive Premier Workshop
- One-Day Options Course
- OptionsPro
- Retirement Income Workshop
- Sure-Fire Trading Systems (VectorVest, Inc.)
- Trading as a Business Workshop
- VectorVest 7 EOD
- VectorVest 7 RealTime/IntraDay
- VectorVest AutoTester
- VectorVest Educational Services
- VectorVest OnLine
- VectorVest Options Analyzer
- VectorVest ProGraphics v6.0
- VectorVest ProTrader 7
- VectorVest RealTime Derby Tool
- VectorVest Simulator
- VectorVest Variator
- VectorVest Watchdog
