HOT TOPICS LIST
- MACD
- Fibonacci
- RSI
- Gann
- ADXR
- Stochastics
- Volume
- Triangles
- Futures
- Cycles
- Volatility
- ZIGZAG
- MESA
- Retracement
- Aroon
INDICATORS LIST
LIST OF TOPICS
PRINT THIS ARTICLE
by Gary Grosschadl
Since topping out at the first of the year, IBM has faltered. Lower targets are in sight as two technical tests approach.
Position: Sell
Gary Grosschadl
Independent Canadian equities trader and technical analyst based in Peterborough
Ontario, Canada.
PRINT THIS ARTICLE
CHART ANALYSIS
Big Blue Has Lower Targets
02/11/05 08:39:45 AMby Gary Grosschadl
Since topping out at the first of the year, IBM has faltered. Lower targets are in sight as two technical tests approach.
Position: Sell
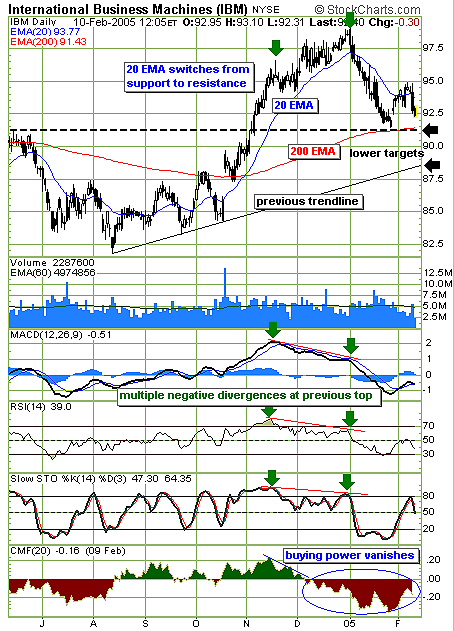
| Figure 1 suggests a short-term sell. Longer term, it is still bullish as the stock is above its 200-period exponential moving average (EMA) on both daily and weekly charts and above several trendlines on those charts as well. |
| On the daily chart, the 20-day EMA served the short-term trader well since it crossed above the 200-day EMA. This exponential moving average proved to be a strong support line as IBM thrusted higher. Since this top, this same 20-day EMA line is just as relevant on the bear side, as it has switched from previous strong support to what is now overhead resistance. |

|
| Figure 1: IBM. IBM drifts lower looking for a possible bounce off lower targets. |
| Graphic provided by: StockCharts.com. |
| |
| Hindsight is a beautiful thing. I often mention the importance of multiple divergences, and here, a great example is illustrated. Note the multiple negative divergences (green arrows) shown as the stock pushed higher, yet the lower indicators went the other way. This is a superior trading signal most times, and this was a prime example. The Chaikin money flow (CMF) indicator also showed an extreme negative divergence. When buying power vanishes, it is a tipoff that bullish forces are abandoning a stock and the stock is due for a downleg. |
| Two lower targets are shown via the black arrows, the higher one being the oft-mportant 200-day EMA. Stocks often will attempt a bounce at or near this line, and this was the case several weeks ago. Note how this level also coincides with a previous resistance level from last summer. Should this level of ~ 91.40 fail to hold, then the next possible support level is the previous trendline at $88.50. |
| In summary, from a short-term trading point of view, I am bearish on IBM until it can sustain itself above its 20-day EMA. A bounce off either target level may give a short-term trading opportunity as a "failure" move to overhead resistance at either the 20 EMA or the congestion area at or near $95. |
Independent Canadian equities trader and technical analyst based in Peterborough
Ontario, Canada.
| Website: | www.whatsonsale.ca/financial.html |
| E-mail address: | gwg7@sympatico.ca |
Click here for more information about our publications!
Comments
Date: 02/11/05Rank: 5Comment:

Request Information From Our Sponsors
- StockCharts.com, Inc.
- Candle Patterns
- Candlestick Charting Explained
- Intermarket Technical Analysis
- John Murphy on Chart Analysis
- John Murphy's Chart Pattern Recognition
- John Murphy's Market Message
- MurphyExplainsMarketAnalysis-Intermarket Analysis
- MurphyExplainsMarketAnalysis-Visual Analysis
- StockCharts.com
- Technical Analysis of the Financial Markets
- The Visual Investor
- VectorVest, Inc.
- Executive Premier Workshop
- One-Day Options Course
- OptionsPro
- Retirement Income Workshop
- Sure-Fire Trading Systems (VectorVest, Inc.)
- Trading as a Business Workshop
- VectorVest 7 EOD
- VectorVest 7 RealTime/IntraDay
- VectorVest AutoTester
- VectorVest Educational Services
- VectorVest OnLine
- VectorVest Options Analyzer
- VectorVest ProGraphics v6.0
- VectorVest ProTrader 7
- VectorVest RealTime Derby Tool
- VectorVest Simulator
- VectorVest Variator
- VectorVest Watchdog
