HOT TOPICS LIST
- MACD
- Fibonacci
- RSI
- Gann
- ADXR
- Stochastics
- Volume
- Triangles
- Futures
- Cycles
- Volatility
- ZIGZAG
- MESA
- Retracement
- Aroon
INDICATORS LIST
LIST OF TOPICS
PRINT THIS ARTICLE
by David Penn
A breakout from an ascending triangle in January retreats before reaching its price target.
Position: N/A
David Penn
Technical Writer for Technical Analysis of STOCKS & COMMODITIES magazine, Working-Money.com, and Traders.com Advantage.
PRINT THIS ARTICLE
ASCENDING TRIANGLES
Down Goes The Dollar?
02/11/05 10:19:00 AMby David Penn
A breakout from an ascending triangle in January retreats before reaching its price target.
Position: N/A
| It's hard to blame gold bugs for their glee as the US dollar, which appeared to bottom late in December 2004 and had been moving higher (generally speaking) over the course of January 2005, rolls over in February. After all, while the January moves upward from the dollar's late December bottom have been modest, the January moves downward from the December highs in gold, the euro, and other "anti-greenback" assets have been sharp and severe. |
| But what can we make, really, of the dollar's recent dip? Does weakness in mid-February represent the end of the greenback's little early-year bounce--or is this weakness merely a pullback in the early days and weeks of an intermediate bull market in the dollar? |

|
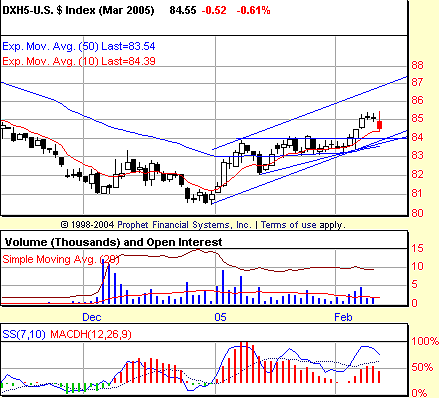
| Figure 1: The negative stochastic divergence in December led to sideways trading in the March greenback. Will a negative stochastic divergence between the December and January peaks lead to a similarly stagnant market--or a sharp reversal? |
| Graphic provided by: Prophet Financial, Inc. |
| |
| Taking first things first, we must recognize that dollar futures (basis March 2005) have been moving higher in a solid trend channel since late December. That channel, so far, has contained weakness, with the lower boundary providing support at 84 and higher. The dollar is also still trading above its 10-day exponential moving average (EMA)--a sign of true trend strength. That situation could change overnight, but until it does, the dollar is closer to being in a "buy the dip" market than a "sell the rally" market. |
| Another factor in favor of the bullish argument is the notion that the dollar broke out of an ascending triangle pattern in February. The triangle was a bit extended, but the breakout occurred before the converging trendlines actually converged and there is a clear, rising volume trend leading up to and during the three-day move that saw the March dollar move up to and above the 84 level. The breakout has yet to reach a minimum upside of about 86. While it is possible that the breakout will fail, it is no less possible that current weakness merely represents a pause and test of the breakout level before resuming its move en route to the minimum projected upside area. This may be especially so in the context of some of these other relatively bullish factors. |
| Nevertheless, the bearish argument against an advancing dollar (at least the technically bearish argument) includes such factors as the development of a negative stochastic divergence between the successively higher price peaks in the dollar in January and February, and the successively lower price peaks in the 7,10 stochastic. Negative divergences are no guarantor of reversals to the downside. But most lasting tops tend to feature them at one periodicity or another. In the event of followthrough to the downside, there are two levels worth watching. The first is a moving average convergence/divergence histogram-based sell point at 83.54, and the second is a negative divergence confirmation point at about 82.72. If the March dollar falls to the former, then there is a reasonable chance it will reach the latter as well. |
Technical Writer for Technical Analysis of STOCKS & COMMODITIES magazine, Working-Money.com, and Traders.com Advantage.
| Title: | Technical Writer |
| Company: | Technical Analysis, Inc. |
| Address: | 4757 California Avenue SW |
| Seattle, WA 98116 | |
| Phone # for sales: | 206 938 0570 |
| Fax: | 206 938 1307 |
| Website: | www.Traders.com |
| E-mail address: | DPenn@traders.com |
Traders' Resource Links | |
| Charting the Stock Market: The Wyckoff Method -- Books | |
| Working-Money.com -- Online Trading Services | |
| Traders.com Advantage -- Online Trading Services | |
| Technical Analysis of Stocks & Commodities -- Publications and Newsletters | |
| Working Money, at Working-Money.com -- Publications and Newsletters | |
| Traders.com Advantage -- Publications and Newsletters | |
| Professional Traders Starter Kit -- Software | |
Click here for more information about our publications!
Comments
Date: 02/11/05Rank: 3Comment:
Date: 02/22/05Rank: 4Comment:

Request Information From Our Sponsors
- StockCharts.com, Inc.
- Candle Patterns
- Candlestick Charting Explained
- Intermarket Technical Analysis
- John Murphy on Chart Analysis
- John Murphy's Chart Pattern Recognition
- John Murphy's Market Message
- MurphyExplainsMarketAnalysis-Intermarket Analysis
- MurphyExplainsMarketAnalysis-Visual Analysis
- StockCharts.com
- Technical Analysis of the Financial Markets
- The Visual Investor
- VectorVest, Inc.
- Executive Premier Workshop
- One-Day Options Course
- OptionsPro
- Retirement Income Workshop
- Sure-Fire Trading Systems (VectorVest, Inc.)
- Trading as a Business Workshop
- VectorVest 7 EOD
- VectorVest 7 RealTime/IntraDay
- VectorVest AutoTester
- VectorVest Educational Services
- VectorVest OnLine
- VectorVest Options Analyzer
- VectorVest ProGraphics v6.0
- VectorVest ProTrader 7
- VectorVest RealTime Derby Tool
- VectorVest Simulator
- VectorVest Variator
- VectorVest Watchdog
