HOT TOPICS LIST
- MACD
- Fibonacci
- RSI
- Gann
- ADXR
- Stochastics
- Volume
- Triangles
- Futures
- Cycles
- Volatility
- ZIGZAG
- MESA
- Retracement
- Aroon
INDICATORS LIST
LIST OF TOPICS
PRINT THIS ARTICLE
by Koos van der Merwe
This stock was worth watching in September 2004. The price then was $0.92. Had you bought...
Position: N/A
Koos van der Merwe
Has been a technical analyst since 1969, and has worked as a futures and options trader with First Financial Futures in Johannesburg, South Africa.
PRINT THIS ARTICLE
SYMMETRICAL TRIANGLE
Aastrom Biosciences, Revisited
02/10/05 11:15:18 AMby Koos van der Merwe
This stock was worth watching in September 2004. The price then was $0.92. Had you bought...
Position: N/A
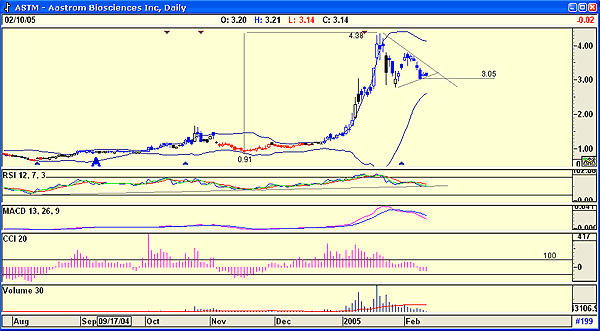
I concluded in an article I wrote for Traders.com Advantage on September 20, 2004, that Aastrom was worth keeping an eye on. As of January 20, 2005, the share price of Aastrom had reached a high of $4.38. Since then, however, it has fallen back and appears to be forming a consolidation triangle, with a break above the downward trendline of the triangle confirming a buy signal. The target price would then be the distance taken to enter the triangle added to the low closest to the apex of the triangle (see Figure 1). In this case, it would be $4.38 - 0.91 = 3.37 + 3.05 = $6.42. What are the chances of a breakout occurring? Figure 1: Aastrom Biosciences. What are the chances of a breakout occurring? Graphic provided by AdvancedGET. |
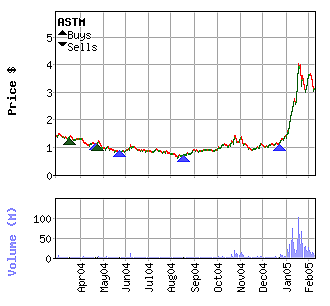
| The positive signals: -The relative strength index (RSI) is testing a trendline drawn along its lows. Whether this is effective as a suggestion of a buy signal is a very real question, as the dramatic rise of the share price occurred without the indicator falling below the 30 level. -The Bollinger Band has started to narrow, suggesting that volatility is drying up. -Volume started to dry up as the share price fell, suggesting strength. -The bar of the ticker is blue. This is colored by the XTL tool that is one of the many studies available with AdvancedGET. This simple tool suggests the following: If the bars are blue, the trend is up. If the bars are red, the trend is down. -Insider activity. Figure 2, from Findlaw Financial, shows that insiders are buying the stock. This is a very strong plus. |

|
| Figure 2: Aastrom insider activity. Insiders are buying the stock. |
| Graphic provided by: AdvancedGET. |
| Graphic provided by: Findlaw Financial. |
| |
| The negatives are: -The RSI, which has not fallen below the 30 level, suggesting an oversold condition. -The moving average convergence/divergence (MACD) indicator is still in a sell mode, and has not hinted at a turn. -The commodity channel index, although below the zero midpoint, has not fallen below the -100 level. |
| To conclude, the stock is tracing a consolidation triangle as some investors take excellent profits, while others consider buying the stock. I would wait for a break above the upper trendline before buying. This stock is definitely on my watchlist. |
Has been a technical analyst since 1969, and has worked as a futures and options trader with First Financial Futures in Johannesburg, South Africa.
| Address: | 3256 West 24th Ave |
| Vancouver, BC | |
| Phone # for sales: | 6042634214 |
| E-mail address: | petroosp@gmail.com |
Click here for more information about our publications!
Comments
Date: 02/11/05Rank: 4Comment:

Request Information From Our Sponsors
- StockCharts.com, Inc.
- Candle Patterns
- Candlestick Charting Explained
- Intermarket Technical Analysis
- John Murphy on Chart Analysis
- John Murphy's Chart Pattern Recognition
- John Murphy's Market Message
- MurphyExplainsMarketAnalysis-Intermarket Analysis
- MurphyExplainsMarketAnalysis-Visual Analysis
- StockCharts.com
- Technical Analysis of the Financial Markets
- The Visual Investor
- VectorVest, Inc.
- Executive Premier Workshop
- One-Day Options Course
- OptionsPro
- Retirement Income Workshop
- Sure-Fire Trading Systems (VectorVest, Inc.)
- Trading as a Business Workshop
- VectorVest 7 EOD
- VectorVest 7 RealTime/IntraDay
- VectorVest AutoTester
- VectorVest Educational Services
- VectorVest OnLine
- VectorVest Options Analyzer
- VectorVest ProGraphics v6.0
- VectorVest ProTrader 7
- VectorVest RealTime Derby Tool
- VectorVest Simulator
- VectorVest Variator
- VectorVest Watchdog
