HOT TOPICS LIST
- MACD
- Fibonacci
- RSI
- Gann
- ADXR
- Stochastics
- Volume
- Triangles
- Futures
- Cycles
- Volatility
- ZIGZAG
- MESA
- Retracement
- Aroon
INDICATORS LIST
LIST OF TOPICS
PRINT THIS ARTICLE
by David Penn
A symmetrical triangle in the regional bank HOLDRS breaks out to the upside as the weight of the market tries to drag the banks back down.
Position: N/A
David Penn
Technical Writer for Technical Analysis of STOCKS & COMMODITIES magazine, Working-Money.com, and Traders.com Advantage.
PRINT THIS ARTICLE
SYMMETRICAL TRIANGLE
About Those Banks ...
02/10/05 07:38:48 AMby David Penn
A symmetrical triangle in the regional bank HOLDRS breaks out to the upside as the weight of the market tries to drag the banks back down.
Position: N/A
| Late last month, I wrote a Traders.com Advantage article highlighting the symmetrical triangle in the regional banks HOLDRS, or RKH ("The Symmetrical Triangle And The Regional Banks," January 31, 2005). While my (unspoken) suspicions at the time were that the RKH was perhaps more likely to break down than break out, I cautioned that traders would best be served by being "patient, waiting for the regional banks to begin to show their hand, before 'seeing' their call.'" |
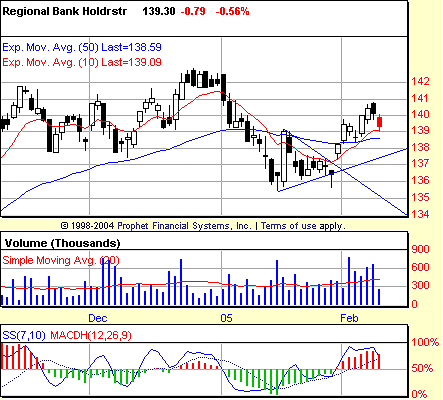
| As Figure 1 shows, this triangle put out a bit of a feint before moving into a reversal as January ended and February began. That feint came in the form of a hammer candlestick on January 28 that, while certainly breaking free on an intraday basis from the converging trendlines that formed the symmetrical triangle over the course of the second half of January, nevertheless warned of reversal. The relatively long lower shadow, that day's close at support at the lower boundary of the triangle, and the inability of prices to take out--even on an intraday basis--the pivot low from January 14 (itself a hammer candlestick) all hinted that the downside was limited. |

|
| Figure 1: Shortly after reaching a minimum upside price projection, this breakout in the regional banks HOLDRS meets resistance and begins to pull back toward potential support at its 10- and 50-day EMAs. |
| Graphic provided by: Prophet Financial, Inc. |
| |
| Given the formation size of the triangle--just over three points--and a likely breakdown/breakout area near 137, traders could have anticipated a minimum retreat to the 134 area or a minimum advance to the 140 area. Fortunately, the day after that late January hammer candlestick saw prices for RKH gap up, escaping the triangle completely. While it would take another two days for volume to propel the breakout higher (that is, above the top of the symmetrical triangle itself), the breakout from the triangle was now clear. |
| Almost on cue, RKH rallied to a closing high of about 140.50 before pulling back. And given the fact that this pullback has returned RKH to a level of potential support at the 10- and 50-day exponential moving averages (EMAs), there is every reason to believe the banks are capable of rallying back to--or even surpassing--their breakout high just short of 141. |
| There is one caveat: The breakout from the symmetrical triangle has created a negative stochastic divergence that could be signaling the end of the advance. Confirmation of this negative stochastic divergence would come if the RKH were to fall to below 138.75 or so. An even earlier short signal based on this negative stochastic divergence was provided courtesy of the moving average convergence/divergence histogram (MACDH) method, which created a sell point at 139.19 that was triggered on February 9. |
Technical Writer for Technical Analysis of STOCKS & COMMODITIES magazine, Working-Money.com, and Traders.com Advantage.
| Title: | Technical Writer |
| Company: | Technical Analysis, Inc. |
| Address: | 4757 California Avenue SW |
| Seattle, WA 98116 | |
| Phone # for sales: | 206 938 0570 |
| Fax: | 206 938 1307 |
| Website: | www.Traders.com |
| E-mail address: | DPenn@traders.com |
Traders' Resource Links | |
| Charting the Stock Market: The Wyckoff Method -- Books | |
| Working-Money.com -- Online Trading Services | |
| Traders.com Advantage -- Online Trading Services | |
| Technical Analysis of Stocks & Commodities -- Publications and Newsletters | |
| Working Money, at Working-Money.com -- Publications and Newsletters | |
| Traders.com Advantage -- Publications and Newsletters | |
| Professional Traders Starter Kit -- Software | |
Click here for more information about our publications!
Comments
Date: 02/11/05Rank: 3Comment:

|

Request Information From Our Sponsors
- VectorVest, Inc.
- Executive Premier Workshop
- One-Day Options Course
- OptionsPro
- Retirement Income Workshop
- Sure-Fire Trading Systems (VectorVest, Inc.)
- Trading as a Business Workshop
- VectorVest 7 EOD
- VectorVest 7 RealTime/IntraDay
- VectorVest AutoTester
- VectorVest Educational Services
- VectorVest OnLine
- VectorVest Options Analyzer
- VectorVest ProGraphics v6.0
- VectorVest ProTrader 7
- VectorVest RealTime Derby Tool
- VectorVest Simulator
- VectorVest Variator
- VectorVest Watchdog
- StockCharts.com, Inc.
- Candle Patterns
- Candlestick Charting Explained
- Intermarket Technical Analysis
- John Murphy on Chart Analysis
- John Murphy's Chart Pattern Recognition
- John Murphy's Market Message
- MurphyExplainsMarketAnalysis-Intermarket Analysis
- MurphyExplainsMarketAnalysis-Visual Analysis
- StockCharts.com
- Technical Analysis of the Financial Markets
- The Visual Investor
