HOT TOPICS LIST
- MACD
- Fibonacci
- RSI
- Gann
- ADXR
- Stochastics
- Volume
- Triangles
- Futures
- Cycles
- Volatility
- ZIGZAG
- MESA
- Retracement
- Aroon
INDICATORS LIST
LIST OF TOPICS
PRINT THIS ARTICLE
by Han Kim
It's another election year but can we expect the market to perform well?
Position: N/A
Han Kim
Traders.com Advantage Staff Writer
PRINT THIS ARTICLE
CYCLES
Trading The Presidential Cycle
06/14/00 04:04:11 PMby Han Kim
It's another election year but can we expect the market to perform well?
Position: N/A
| The markets tend to perform well during the election year because politicians, vying for votes, like to pass legislation favorable to the economy. Historically, this has been verified by the stock market, whose indexes clearly repeat a pattern that follows the four-year presidential cycle. |
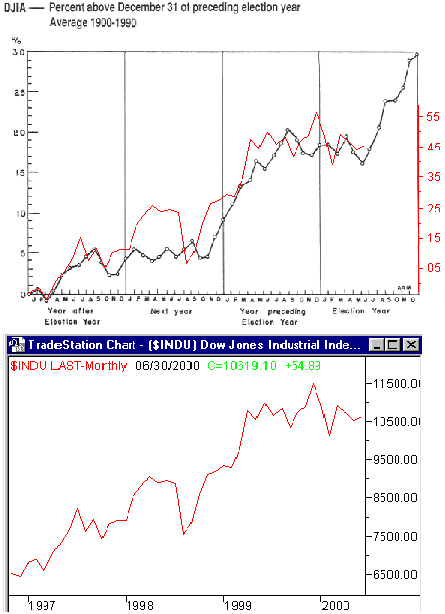
| Noted technical analysist Arthur A. Merrill, among others, has researched and found a correlation between the stock market and the presidential cycle. In his March 1992 article "The Presidential Election Cycle" published in Technical Analysis of STOCKS & COMMODITIES, Merrill broke down the years from 1900 to 1990 into four-year segments based on the presidential election cycle. He then found the percentage change per month, and averaged the percentages by year, according to which year of the four-year cycle they fell upon. A chart of his results (Figure 1, upper) shows the pattern that formed during that cycle. Generally, the last two years of a presidential cycle performed better than the first two. |

|
| Figure 1: Upper chart: The current presidential cycle's Dow Jones Industrial Average (DJIA) performance (red line) has been superimposed over Merrill's averages for 1900-1990. Lower chart: The DJIA for the current presidential cycle. |
| Graphic provided by: TradeStation. |
| |
| Does the current presidential cycle follow Merrill's chart? I have superimposed the performance of the DJIA for the first three and half years of this presidential cycle over Merrill's chart. Although the percentages are different, the chart seems to confirm that these first three years of this presidential cycle are following the general trend, although the second year of our current cycle has done slightly better than the model. I anticipate second half of this election year probably will follow suit and perform well. |
Traders.com Advantage Staff Writer
| Title: | Webmaster |
| Company: | Technical Analysis, Inc. |
| Address: | 4757 California AVE SW |
| Seattle, WA 98116 | |
| Phone # for sales: | 206-938-0570 |
| Fax: | 206-938-1307 |
| Website: | www.traders.com |
| E-mail address: | hkim@traders.com |
Traders' Resource Links | |
| Charting the Stock Market: The Wyckoff Method -- Books | |
| Working-Money.com -- Online Trading Services | |
| Traders.com Advantage -- Online Trading Services | |
| Technical Analysis of Stocks & Commodities -- Publications and Newsletters | |
| Working Money, at Working-Money.com -- Publications and Newsletters | |
| Traders.com Advantage -- Publications and Newsletters | |
| Professional Traders Starter Kit -- Software | |
Click here for more information about our publications!
Comments
Date: / /Rank: 4Comment:

Request Information From Our Sponsors
- StockCharts.com, Inc.
- Candle Patterns
- Candlestick Charting Explained
- Intermarket Technical Analysis
- John Murphy on Chart Analysis
- John Murphy's Chart Pattern Recognition
- John Murphy's Market Message
- MurphyExplainsMarketAnalysis-Intermarket Analysis
- MurphyExplainsMarketAnalysis-Visual Analysis
- StockCharts.com
- Technical Analysis of the Financial Markets
- The Visual Investor
- VectorVest, Inc.
- Executive Premier Workshop
- One-Day Options Course
- OptionsPro
- Retirement Income Workshop
- Sure-Fire Trading Systems (VectorVest, Inc.)
- Trading as a Business Workshop
- VectorVest 7 EOD
- VectorVest 7 RealTime/IntraDay
- VectorVest AutoTester
- VectorVest Educational Services
- VectorVest OnLine
- VectorVest Options Analyzer
- VectorVest ProGraphics v6.0
- VectorVest ProTrader 7
- VectorVest RealTime Derby Tool
- VectorVest Simulator
- VectorVest Variator
- VectorVest Watchdog
