HOT TOPICS LIST
- MACD
- Fibonacci
- RSI
- Gann
- ADXR
- Stochastics
- Volume
- Triangles
- Futures
- Cycles
- Volatility
- ZIGZAG
- MESA
- Retracement
- Aroon
INDICATORS LIST
LIST OF TOPICS
PRINT THIS ARTICLE
by Kevin Hopson
As expected, long-term bond prices have broken to the upside. With pessimism still building, prices likely have higher to go.
Position: N/A
Kevin Hopson
Kevin has been a technical analyst for roughly 10 years now. Previously, Kevin owned his own business and acted as a registered investment advisor, specializing in energy. He was also a freelance oil analyst for Orient Trading Co., a commodity futures trading firm in Japan. Kevin is currently a freelance writer.
PRINT THIS ARTICLE
TECHNICAL ANALYSIS
Why Long-Term Bond Prices Show No Signs Of Reversing
02/08/05 08:51:29 AMby Kevin Hopson
As expected, long-term bond prices have broken to the upside. With pessimism still building, prices likely have higher to go.
Position: N/A
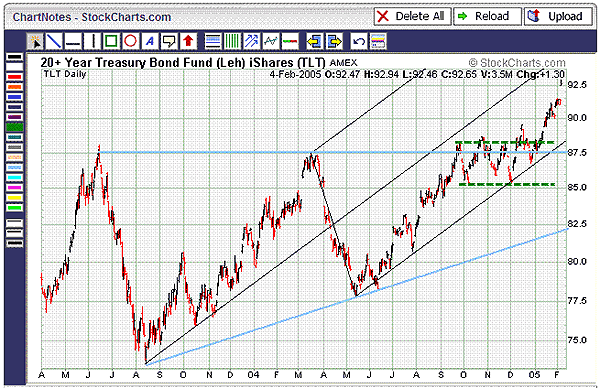
| The last time I touched on the Lehman 20+ Year Treasure Bond Fund (TLT) was back in December 2004. At that time, I was predicting higher long-term bond prices, as TLT was consolidating in a bullish trading range. This is illustrated by the dotted green lines. As you can see, prices have broken out of the trading range, indicating a short-term upside target of between $94.75 and $97.50. For details on how to calculate price targets based on trading range breakouts, please refer to my earlier article on the subject, "Are Long-Term Bond Prices Headed Higher?" |
| In my previous article, I also touched on the long-term ascending triangle formation, which is illustrated by the blue trendlines. Based on this pattern breakout, TLT could make its way above the $100 level in the longer term. I calculated this price target by taking the base of the triangle (high point - low point) and adding this figure ($87.50-$74.00=$13.50) to the point of breakout ($87.50+$13.50=$101). |

|
| Figure 1: TLT. Prices have broken out of the trading range for TLT, indicating a short-term upside target of between $94.75 and $97.50. |
| Graphic provided by: StockCharts.com. |
| |
| Even if we did not have price targets on which to base our investment decision, sentiment analysis would still point to higher prices. For example, the put/call open interest ratio for the front three months is currently 7.02, which is at its highest level since 2003. In addition, short interest as of early January was 21.55 million shares (Source: Schaeffer's Investment Research: http://www.schaeffersresearch.com). This means that the short interest ratio -- based on average daily volume of 1.09 million shares -- is nearly 20.0x. |
| Because the put/call open interest ratio and short interest are both near all-time highs, investors are betting heavily on a top in long-term bond prices. As you know, significant tops typically occur when market sentiment is overly bullish. This tends to be the case because everyone is already in and there is no place to go but down. Given the extreme pessimism toward shares of TLT, it is unlikely that long-term bond prices have seen their highs. Further, there is substantial buying pressure to push prices higher. |
Kevin has been a technical analyst for roughly 10 years now. Previously, Kevin owned his own business and acted as a registered investment advisor, specializing in energy. He was also a freelance oil analyst for Orient Trading Co., a commodity futures trading firm in Japan. Kevin is currently a freelance writer.
| Glen Allen, VA | |
| E-mail address: | hopson_1@yahoo.com |
Click here for more information about our publications!
Comments
Date: 02/09/05Rank: 3Comment:
Date: 03/01/05Rank: 5Comment:

|

Request Information From Our Sponsors
- StockCharts.com, Inc.
- Candle Patterns
- Candlestick Charting Explained
- Intermarket Technical Analysis
- John Murphy on Chart Analysis
- John Murphy's Chart Pattern Recognition
- John Murphy's Market Message
- MurphyExplainsMarketAnalysis-Intermarket Analysis
- MurphyExplainsMarketAnalysis-Visual Analysis
- StockCharts.com
- Technical Analysis of the Financial Markets
- The Visual Investor
- VectorVest, Inc.
- Executive Premier Workshop
- One-Day Options Course
- OptionsPro
- Retirement Income Workshop
- Sure-Fire Trading Systems (VectorVest, Inc.)
- Trading as a Business Workshop
- VectorVest 7 EOD
- VectorVest 7 RealTime/IntraDay
- VectorVest AutoTester
- VectorVest Educational Services
- VectorVest OnLine
- VectorVest Options Analyzer
- VectorVest ProGraphics v6.0
- VectorVest ProTrader 7
- VectorVest RealTime Derby Tool
- VectorVest Simulator
- VectorVest Variator
- VectorVest Watchdog
