HOT TOPICS LIST
- MACD
- Fibonacci
- RSI
- Gann
- ADXR
- Stochastics
- Volume
- Triangles
- Futures
- Cycles
- Volatility
- ZIGZAG
- MESA
- Retracement
- Aroon
INDICATORS LIST
LIST OF TOPICS
PRINT THIS ARTICLE
by David Penn
The bounce at the end of January in the QQQQ had everything a bull would want--except for strong volume trends.
Position: N/A
David Penn
Technical Writer for Technical Analysis of STOCKS & COMMODITIES magazine, Working-Money.com, and Traders.com Advantage.
PRINT THIS ARTICLE
VOLUME
Declining Volume + Rally = Reversal?
02/04/05 11:31:52 AMby David Penn
The bounce at the end of January in the QQQQ had everything a bull would want--except for strong volume trends.
Position: N/A
| The bounce at the end of January in the QQQQ had everything a bull would want--except for strong volume trends. And now it appears as if the lack of strong volume trends in the QQQQ's rally is about to bite the tech-and-small-cap laden index in the backside. |
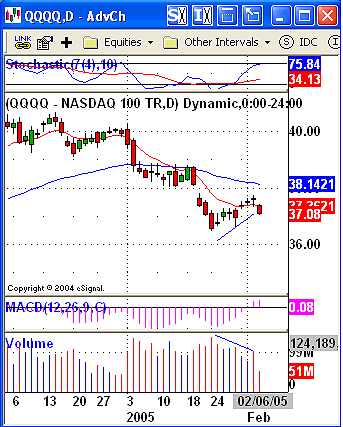
| The rally in the QQQQ that began early in August 2004 began running into trouble in November and December. Although the index continued to advance through the end of December, that advance was marred by running negative stochastic divergences (beginning in mid-November) and lower and lower positive MACDH (moving average convergence/divergence histogram) readings. These readings are extremely low in late November and virtually nonexistent in December while the QQQQ was making its highs for the move. |

|
| Figure 1: A bounce on retreating volume moves closer and closer to potential resistance between the 10- and 50-day EMAs. |
| Graphic provided by: eSignal. |
| |
| Writing in their classic technical analysis tome, TECHNICAL ANALYSIS OF STOCK TRENDS, authors Robert Edwards and John Magee note: "in a Bull Market, volume increases when prices rise and dwindles as prices decline; in Bear Markets, turnover increases when prices drop and dries up as they recover." This is what is meant by the phrase "volume follows the trend." |
| However, there are instances in which volume does not follow the trend--and in those instances often lies serious trouble for that the trend. The current bounce in the QQQQ appears, so far, to offer just that kind of caution to those on the bullish side of things. Note how in the daily QQQQ chart in Figure 1, there is a distinct downward trend in volume beginning with the high volume low in mid-to-late January. This downward volume trend has developed as prices in the QQQQ have moved higher |
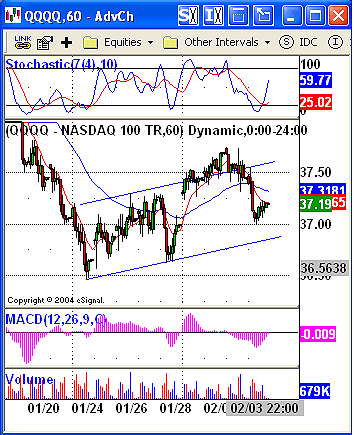
The hourly QQQQ chart in Figure 2 provides a closer look at the advance since late January. Note how, moving into February, the hourly QQQQ began developing a running negative stochastic divergence. This negative divergence has anticipated the initial weakness in the QQQQ on February 3, and may be signaling further weakness--at least in the short term. In some ways, the hourly QQQQ is in straits similar to those of the daily QQQQ: Both charts show a market that is struggling to get above its 10- and 50-period exponential moving averages. Figure 2: Breaking out of the bullish trend channel briefly in early February, the QQQQ slips back into the channel shortly thereafter. |
Technical Writer for Technical Analysis of STOCKS & COMMODITIES magazine, Working-Money.com, and Traders.com Advantage.
| Title: | Technical Writer |
| Company: | Technical Analysis, Inc. |
| Address: | 4757 California Avenue SW |
| Seattle, WA 98116 | |
| Phone # for sales: | 206 938 0570 |
| Fax: | 206 938 1307 |
| Website: | www.Traders.com |
| E-mail address: | DPenn@traders.com |
Traders' Resource Links | |
| Charting the Stock Market: The Wyckoff Method -- Books | |
| Working-Money.com -- Online Trading Services | |
| Traders.com Advantage -- Online Trading Services | |
| Technical Analysis of Stocks & Commodities -- Publications and Newsletters | |
| Working Money, at Working-Money.com -- Publications and Newsletters | |
| Traders.com Advantage -- Publications and Newsletters | |
| Professional Traders Starter Kit -- Software | |
Click here for more information about our publications!
Comments
Date: 02/05/05Rank: 3Comment:
Date: 02/08/05Rank: 5Comment:

Request Information From Our Sponsors
- StockCharts.com, Inc.
- Candle Patterns
- Candlestick Charting Explained
- Intermarket Technical Analysis
- John Murphy on Chart Analysis
- John Murphy's Chart Pattern Recognition
- John Murphy's Market Message
- MurphyExplainsMarketAnalysis-Intermarket Analysis
- MurphyExplainsMarketAnalysis-Visual Analysis
- StockCharts.com
- Technical Analysis of the Financial Markets
- The Visual Investor
- VectorVest, Inc.
- Executive Premier Workshop
- One-Day Options Course
- OptionsPro
- Retirement Income Workshop
- Sure-Fire Trading Systems (VectorVest, Inc.)
- Trading as a Business Workshop
- VectorVest 7 EOD
- VectorVest 7 RealTime/IntraDay
- VectorVest AutoTester
- VectorVest Educational Services
- VectorVest OnLine
- VectorVest Options Analyzer
- VectorVest ProGraphics v6.0
- VectorVest ProTrader 7
- VectorVest RealTime Derby Tool
- VectorVest Simulator
- VectorVest Variator
- VectorVest Watchdog
