HOT TOPICS LIST
- MACD
- Fibonacci
- RSI
- Gann
- ADXR
- Stochastics
- Volume
- Triangles
- Futures
- Cycles
- Volatility
- ZIGZAG
- MESA
- Retracement
- Aroon
INDICATORS LIST
LIST OF TOPICS
PRINT THIS ARTICLE
by Kevin Hopson
As expected, the broader market put in a short-term bottom but prices are now facing resistance.
Position: N/A
Kevin Hopson
Kevin has been a technical analyst for roughly 10 years now. Previously, Kevin owned his own business and acted as a registered investment advisor, specializing in energy. He was also a freelance oil analyst for Orient Trading Co., a commodity futures trading firm in Japan. Kevin is currently a freelance writer.
PRINT THIS ARTICLE
TECHNICAL ANALYSIS
S&P 500 Bumping Up Against Resistance
02/04/05 08:40:31 AMby Kevin Hopson
As expected, the broader market put in a short-term bottom but prices are now facing resistance.
Position: N/A
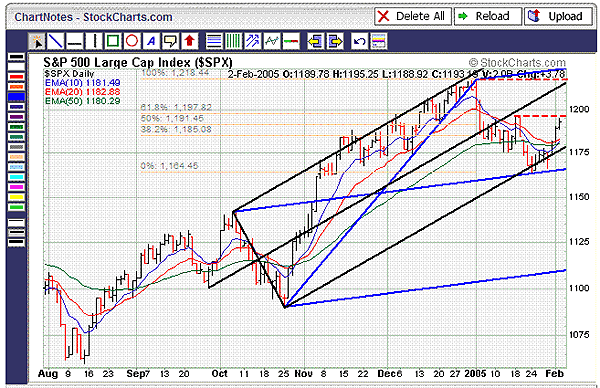
| A couple of weeks ago, I said to watch for a potential bounce in the market, as the CBOE Volatility Index (VIX) was approaching key resistance levels and the Standard & Poor's 100 Index (OEX) was bouncing off support. Needless to say, this reversal came to fruition and equity prices have proceeded to rally. However, if you take a look at a broader index such as the S&P 500 (SPX), you will see that prices are bumping up against key resistance right now. |
| Before I get into this, though, it is important to analyze how the index got here in the first place. For example, prices have been trading in the rising black pitchfork configuration since last October. Even though the SPX slightly breached the bottom parallel line of this pitchfork late last month, prices proceeded to bounce off the blue median line. As a result, the longer-term uptrend remained intact. When the index rallied off this median line and traded back above its short-term moving average, it was a sign that a bottom reversal had occurred. |

|
| Figure 1: SPX. If you take a look at a broader index such as the S&P 500 (SPX), you will see that prices are bumping up against key resistance right now. |
| Graphic provided by: StockCharts.com. |
| |
| If you turn your attention to the February 2nd trading day, you will see that prices now face resistance above the 1195 level. More specifically, the mid-January high and the 61.8% retracement level from the January decline both come into play in the 1196 to 1198 range. If the SPX can overcome resistance here, the index should see a further rally up to the 1215 to 1220 range. This is the site of the black median line and last year's high. |
Kevin has been a technical analyst for roughly 10 years now. Previously, Kevin owned his own business and acted as a registered investment advisor, specializing in energy. He was also a freelance oil analyst for Orient Trading Co., a commodity futures trading firm in Japan. Kevin is currently a freelance writer.
| Glen Allen, VA | |
| E-mail address: | hopson_1@yahoo.com |
Click here for more information about our publications!
Comments
Date: 02/05/05Rank: 4Comment:

|

Request Information From Our Sponsors
- StockCharts.com, Inc.
- Candle Patterns
- Candlestick Charting Explained
- Intermarket Technical Analysis
- John Murphy on Chart Analysis
- John Murphy's Chart Pattern Recognition
- John Murphy's Market Message
- MurphyExplainsMarketAnalysis-Intermarket Analysis
- MurphyExplainsMarketAnalysis-Visual Analysis
- StockCharts.com
- Technical Analysis of the Financial Markets
- The Visual Investor
- VectorVest, Inc.
- Executive Premier Workshop
- One-Day Options Course
- OptionsPro
- Retirement Income Workshop
- Sure-Fire Trading Systems (VectorVest, Inc.)
- Trading as a Business Workshop
- VectorVest 7 EOD
- VectorVest 7 RealTime/IntraDay
- VectorVest AutoTester
- VectorVest Educational Services
- VectorVest OnLine
- VectorVest Options Analyzer
- VectorVest ProGraphics v6.0
- VectorVest ProTrader 7
- VectorVest RealTime Derby Tool
- VectorVest Simulator
- VectorVest Variator
- VectorVest Watchdog
