HOT TOPICS LIST
- MACD
- Fibonacci
- RSI
- Gann
- ADXR
- Stochastics
- Volume
- Triangles
- Futures
- Cycles
- Volatility
- ZIGZAG
- MESA
- Retracement
- Aroon
INDICATORS LIST
LIST OF TOPICS
PRINT THIS ARTICLE
by Arthur Hill
Oracle advanced more than 40% from late August to mid-December, but a filled gap and waning money flow show an exhausted stock.
Position: Sell
Arthur Hill
Arthur Hill is currently editor of TDTrader.com, a website specializing in trading strategies, sector/industry specific breadth stats and overall technical analysis. He passed the Society of Technical Analysts (STA London) diploma exam with distinction is a Certified Financial Technician (CFTe). Prior to TD Trader, he was the Chief Technical Analyst for Stockcharts.com and the main contributor to the ChartSchool.
PRINT THIS ARTICLE
GAPS
Oracle Looks Exhausted
02/04/05 08:18:59 AMby Arthur Hill
Oracle advanced more than 40% from late August to mid-December, but a filled gap and waning money flow show an exhausted stock.
Position: Sell
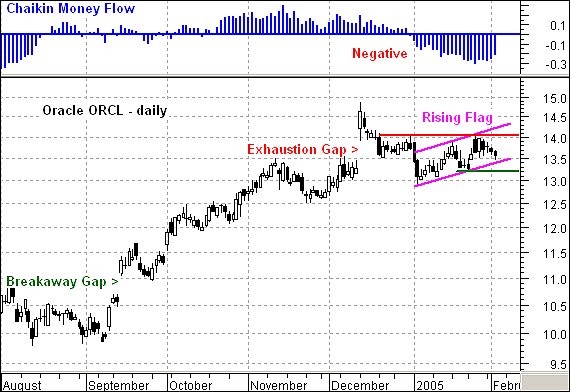
| Gaps come in all shapes and sizes. The first gap for Oracle (ORCL) occurred in September 2004 and should be considered a breakaway gap. The gap formed after a support test in early September and the stock held the gap without any problems. Moreover, the advance continued and the stock raced from 11 to 14.87 over the next few months. As its name implies, the stock foreshadows a breakaway move. |
| The advance in the August-December period was capped by an exhaustion gap. These occur after an extended move as the stock gaps in the direction of the underlying trend, but fails to hold the gap and fills it with a countertrend move. In this case, Oracle was in an uptrend and gapped higher on December 13. The December 13th high was never exceeded, and the stock filled the gap with a decline over the next few weeks. This makes it an exhaustion gap and suggests that the current uptrend is, well, exhausted. |

|
| Figure 1: Oracle. ORCL advanced more than 40% from late August to mid-December, but a filled gap and waning money flow show an exhausted stock. |
| Graphic provided by: MetaStock. |
| Graphic provided by: Reuters Data. |
| |
| Even though the stock recovered in January 2005, the pattern at work is not promising. First, the Chaikin money flow turned negative in early January and remains in negative territory. This indicates distribution over the last few weeks and increases the odds of further weakness. Second, a rising flag formed over the last few weeks, which are typically bearish consolidations. A move below the lower trendline and the January 24th low (13.2) would signal a continuation lower. |
Arthur Hill is currently editor of TDTrader.com, a website specializing in trading strategies, sector/industry specific breadth stats and overall technical analysis. He passed the Society of Technical Analysts (STA London) diploma exam with distinction is a Certified Financial Technician (CFTe). Prior to TD Trader, he was the Chief Technical Analyst for Stockcharts.com and the main contributor to the ChartSchool.
| Title: | Editor |
| Company: | TDTrader.com |
| Address: | Willem Geetsstraat 17 |
| Mechelen, B2800 | |
| Phone # for sales: | 3215345465 |
| Website: | www.tdtrader.com |
| E-mail address: | arthurh@tdtrader.com |
Traders' Resource Links | |
| TDTrader.com has not added any product or service information to TRADERS' RESOURCE. | |
Click here for more information about our publications!
Comments
Date: 02/05/05Rank: 4Comment:

Request Information From Our Sponsors
- VectorVest, Inc.
- Executive Premier Workshop
- One-Day Options Course
- OptionsPro
- Retirement Income Workshop
- Sure-Fire Trading Systems (VectorVest, Inc.)
- Trading as a Business Workshop
- VectorVest 7 EOD
- VectorVest 7 RealTime/IntraDay
- VectorVest AutoTester
- VectorVest Educational Services
- VectorVest OnLine
- VectorVest Options Analyzer
- VectorVest ProGraphics v6.0
- VectorVest ProTrader 7
- VectorVest RealTime Derby Tool
- VectorVest Simulator
- VectorVest Variator
- VectorVest Watchdog
- StockCharts.com, Inc.
- Candle Patterns
- Candlestick Charting Explained
- Intermarket Technical Analysis
- John Murphy on Chart Analysis
- John Murphy's Chart Pattern Recognition
- John Murphy's Market Message
- MurphyExplainsMarketAnalysis-Intermarket Analysis
- MurphyExplainsMarketAnalysis-Visual Analysis
- StockCharts.com
- Technical Analysis of the Financial Markets
- The Visual Investor
