HOT TOPICS LIST
- MACD
- Fibonacci
- RSI
- Gann
- ADXR
- Stochastics
- Volume
- Triangles
- Futures
- Cycles
- Volatility
- ZIGZAG
- MESA
- Retracement
- Aroon
INDICATORS LIST
LIST OF TOPICS
PRINT THIS ARTICLE
by Kevin Hopson
As expected, UEX bounced off key support recently and is once again in rally mode. So what is next for the stock?
Position: N/A
Kevin Hopson
Kevin has been a technical analyst for roughly 10 years now. Previously, Kevin owned his own business and acted as a registered investment advisor, specializing in energy. He was also a freelance oil analyst for Orient Trading Co., a commodity futures trading firm in Japan. Kevin is currently a freelance writer.
PRINT THIS ARTICLE
TECHNICAL ANALYSIS
UEX Corp. Still Looking Strong
02/03/05 08:35:17 AMby Kevin Hopson
As expected, UEX bounced off key support recently and is once again in rally mode. So what is next for the stock?
Position: N/A
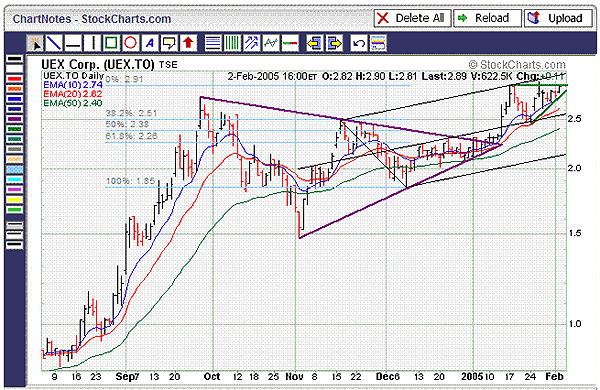
| I touched on UEX Corp. (UEX.TO/UEXCF.PK) just a couple of weeks ago. At that time, the stock was starting to pull back from a sharp rally. Because there was a significant confluence of support around the C$2.50 level, I opined that an attractive buying opportunity could present itself there. In addition, the triangle breakout -- as illustrated by the purple trendlines -- still pointed to much higher prices. More specifically, my upside target was (and still is) C$3.50. |
| As you can see in the six-month chart (Figure 1), UEX bounced off support at the C$2.50 level, just as I anticipated. This was the site of the black median line, the stock's short-term moving averages, and the 38.2% retracement level from the December-January rally. Now that UEX has proceeded to rally, the stock is once again finding resistance around the C$2.90 level. This resistance level first came into play when UEX tested the top parallel line of the black pitchfork in mid-January. Since then, prices have stalled out here. |

|
| Figure 1: UEX. As you can see in the six-month chart, UEX bounced off support at the C$2.50 level, just as anticipated. |
| Graphic provided by: StockCharts.com. |
| |
| However, note how UEX has been putting in a pattern of higher lows, effectively forming an ascending triangle. This is illustrated by the green lines. Because ascending triangles tend to break to the upside, I think it is just a matter of time before UEX breaches resistance here. When and if this occurs, it should pave the way for another significant rally. As a result, I remain optimistic on the stock and would continue to hold shares of UEX Corp. in anticipation of higher prices. |
Kevin has been a technical analyst for roughly 10 years now. Previously, Kevin owned his own business and acted as a registered investment advisor, specializing in energy. He was also a freelance oil analyst for Orient Trading Co., a commodity futures trading firm in Japan. Kevin is currently a freelance writer.
| Glen Allen, VA | |
| E-mail address: | hopson_1@yahoo.com |
Click here for more information about our publications!
Comments
Date: 02/05/05Rank: 3Comment:

Request Information From Our Sponsors
- StockCharts.com, Inc.
- Candle Patterns
- Candlestick Charting Explained
- Intermarket Technical Analysis
- John Murphy on Chart Analysis
- John Murphy's Chart Pattern Recognition
- John Murphy's Market Message
- MurphyExplainsMarketAnalysis-Intermarket Analysis
- MurphyExplainsMarketAnalysis-Visual Analysis
- StockCharts.com
- Technical Analysis of the Financial Markets
- The Visual Investor
- VectorVest, Inc.
- Executive Premier Workshop
- One-Day Options Course
- OptionsPro
- Retirement Income Workshop
- Sure-Fire Trading Systems (VectorVest, Inc.)
- Trading as a Business Workshop
- VectorVest 7 EOD
- VectorVest 7 RealTime/IntraDay
- VectorVest AutoTester
- VectorVest Educational Services
- VectorVest OnLine
- VectorVest Options Analyzer
- VectorVest ProGraphics v6.0
- VectorVest ProTrader 7
- VectorVest RealTime Derby Tool
- VectorVest Simulator
- VectorVest Variator
- VectorVest Watchdog
