HOT TOPICS LIST
- MACD
- Fibonacci
- RSI
- Gann
- ADXR
- Stochastics
- Volume
- Triangles
- Futures
- Cycles
- Volatility
- ZIGZAG
- MESA
- Retracement
- Aroon
INDICATORS LIST
LIST OF TOPICS
PRINT THIS ARTICLE
by David Penn
A running stochastic divergence in the hourly S&P 500 suggests that the end of January bounce may be nearer than farther.
Position: N/A
David Penn
Technical Writer for Technical Analysis of STOCKS & COMMODITIES magazine, Working-Money.com, and Traders.com Advantage.
PRINT THIS ARTICLE
Bye-Bye, Bounce?
02/03/05 08:28:15 AMby David Penn
A running stochastic divergence in the hourly S&P 500 suggests that the end of January bounce may be nearer than farther.
Position: N/A
| In a forthcoming Working-Money.com article, I try to map out the correction that began as of 2005. Using some wave theory, I concluded that the January correction is the second (and likely last) correction in the bull market that began in the Standard & Poor's 500 in August 2004. The first correction took place from late September to late October of that year. |
| The January correction saw the S&P 500 fall below the December lows but avoid the more severe slide that would have been necessary to take out the November lows. At the end of the month, the correction seemed to end as the S&P 500 moved sharply higher. Did this advance signify the end of the January correction? |

|
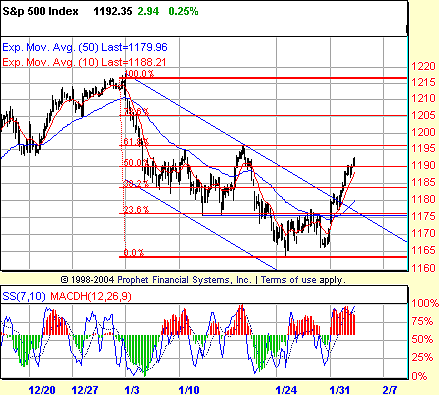
| Figure 1: The end of the month bounce in this chart of the hourly S&P 500 suggests an important test of resistance at the 61.8% retracement level--a level that coincides with the highs of January 18. |
| Graphic provided by: Prophet Financial, Inc. |
| |
| My guess at this point is no. In the Working Money article, I suggested that the 1177 level might prove sufficient resistance to any immediate-term advance. This resistance lasted for a few days but was shattered on the last day of the month by a market that continued to move higher, showing evidence of the sort of followthrough that might otherwise signify a resumption of the bull market. The S&P 500 is now hurtling toward what should be a far more formative resistance level near 1196. This represents the reaction high for the downtrend that began in early January, and a close above this level would be especially bullish. That level, however, should serve as resistance insofar as it does mark a level beyond which buyers were willing to go. That level also represents a 61.8% retracement of the January correction, which may contribute to the degree of resistance near 1196. There is an additional reason why the 61.8% retracement level might be especially significant. Again, to refer to the Working Money article, I wrote that the January correction would likely take the form of a zigzag--in contrast to the flat of the previous September/October 2004 correction. In that article, written before the lows of January 12 and 13 were taken out, I suggested that these lows might represent the end of the first leg down in the zigzag (the "a" wave). In light of recent developments, it seems apparent that the end of the first leg actually arrived on the last day of January, and that the current move higher is part of the second leg in the zigzag, the bullish "b" wave. |
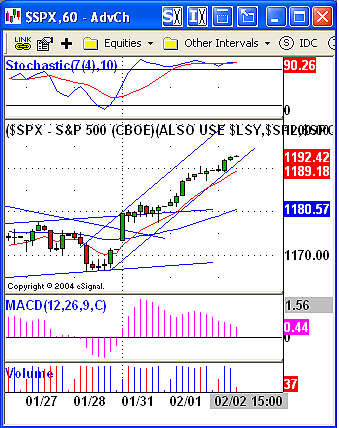
| If this is the case, then the current advance from the end of January lows should not advance by more than 61.8% of the previous decline. If the present bounce finds resistance at the 1196 level, the 61.8% retracement level, then the forecast for a zigzag correction will remain viable. Failing that, in the event of a strong move above this level, then another sort of correction might likely be taking place--such as another flat or even a triangle--that might see the S&P 500 retesting its January highs before the correction is complete. Another reason to suspect that the bounce may be running out of gas as it enters the 1190s is the multiple or "running" negative stochastic divergence apparent on the hourly charts. While it is true that running divergences can be common features in trending markets, the fact that the S&P 500 is developing these divergences at the same time as it is nearing significant challenges to its trend makes those divergences worth watching. Not as clear on the Prophet.net shown in Figure 1, the eSignal chart in Figure 2 makes the negative stochastic divergences in the hourly chart worth watching.  Figure 2: A running negative stochastic divergence develops as the S&P 500 streaks toward potential resistance near the 1196 level. Chart by eSignal |
| The hourly S&P 500 is above its 10-hour exponential moving average--always a good indication of a market in a strong trend. However, the hourly S&P 500 is closer to the lower boundary of its trend channel than it is to the upper boundary. This suggests one of two likely resolutions: either the lower boundary becomes support and the S&P 500 moves from its current challenging-but-sustainable angle of ascent to an angle of ascent that is near vertical, or the S&P 500 plows into the side of the trend channel, breaking the support of the lower boundary and setting up the opportunity for a reversal to the downside. |
Technical Writer for Technical Analysis of STOCKS & COMMODITIES magazine, Working-Money.com, and Traders.com Advantage.
| Title: | Technical Writer |
| Company: | Technical Analysis, Inc. |
| Address: | 4757 California Avenue SW |
| Seattle, WA 98116 | |
| Phone # for sales: | 206 938 0570 |
| Fax: | 206 938 1307 |
| Website: | www.Traders.com |
| E-mail address: | DPenn@traders.com |
Traders' Resource Links | |
| Charting the Stock Market: The Wyckoff Method -- Books | |
| Working-Money.com -- Online Trading Services | |
| Traders.com Advantage -- Online Trading Services | |
| Technical Analysis of Stocks & Commodities -- Publications and Newsletters | |
| Working Money, at Working-Money.com -- Publications and Newsletters | |
| Traders.com Advantage -- Publications and Newsletters | |
| Professional Traders Starter Kit -- Software | |
Click here for more information about our publications!
Comments
Date: 02/05/05Rank: 4Comment:
Date: 02/08/05Rank: 4Comment:

|

Request Information From Our Sponsors
- StockCharts.com, Inc.
- Candle Patterns
- Candlestick Charting Explained
- Intermarket Technical Analysis
- John Murphy on Chart Analysis
- John Murphy's Chart Pattern Recognition
- John Murphy's Market Message
- MurphyExplainsMarketAnalysis-Intermarket Analysis
- MurphyExplainsMarketAnalysis-Visual Analysis
- StockCharts.com
- Technical Analysis of the Financial Markets
- The Visual Investor
- VectorVest, Inc.
- Executive Premier Workshop
- One-Day Options Course
- OptionsPro
- Retirement Income Workshop
- Sure-Fire Trading Systems (VectorVest, Inc.)
- Trading as a Business Workshop
- VectorVest 7 EOD
- VectorVest 7 RealTime/IntraDay
- VectorVest AutoTester
- VectorVest Educational Services
- VectorVest OnLine
- VectorVest Options Analyzer
- VectorVest ProGraphics v6.0
- VectorVest ProTrader 7
- VectorVest RealTime Derby Tool
- VectorVest Simulator
- VectorVest Variator
- VectorVest Watchdog
