HOT TOPICS LIST
- MACD
- Fibonacci
- RSI
- Gann
- ADXR
- Stochastics
- Volume
- Triangles
- Futures
- Cycles
- Volatility
- ZIGZAG
- MESA
- Retracement
- Aroon
INDICATORS LIST
LIST OF TOPICS
PRINT THIS ARTICLE
by David Penn
Q. Why did the consolidation cross the uptrend?
Position: N/A
David Penn
Technical Writer for Technical Analysis of STOCKS & COMMODITIES magazine, Working-Money.com, and Traders.com Advantage.
PRINT THIS ARTICLE
CONSOLID FORMATION
Consolidations In Trends
02/02/05 08:45:14 AMby David Penn
Q. Why did the consolidation cross the uptrend?
Position: N/A
| A. To help the market move higher! One technical analysis maxim that continues to stand the test of time is the notion that consolidations that appear in trends often serve as accumulation/distribution zones. It is in these instances--during which there is a relative consensus on the value of the market being traded--that "smart money" either buys shares from or sells to "dumb money." |
| In uptrends, it is those who are confident that prices will move even higher who buy from those who are fearful that the best in price appreciation has already happened. In downtrends, on the other hand, it is those who suspect that prices will move even lower who sell to those who believe that the worst is over. Almost by definition, then, the smart money accumulates in uptrends and distributes in downtrends. |

|
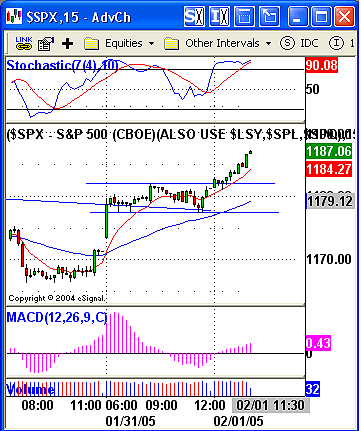
| Figure 1: Leaping up into the last day of January, the S&P 500 spent that final session moving sideways before breaking free of its consolidation and continuing its rally. |
| Graphic provided by: eSignal. |
| |
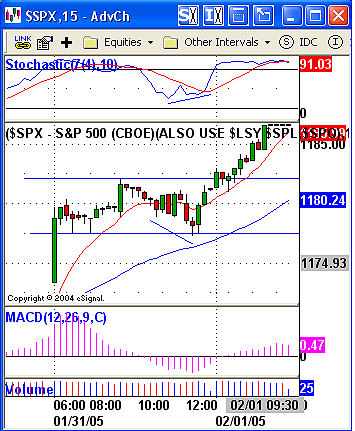
| The earlier in the move, the "smarter" that money is said to be. In the case of the Standard & Poor's 500's bounce in early February, the smart money seems to have stepped in on the final days of January. The market was making lower lows for much of the month. But moving into the last full week, the S&P 500 began moving sideways. In fact, the S&P 500 moved sideways in a largely five-point range for three out of five days to finish off the month. It appears clear now that this was a moment of accumulation, as the S&P 500 shot out of the gate on January 31, advancing nearly 10 points in less than an hour. Those who arrived late at the bull party found their patience tested as the market moved immediately into another consolidation range. Would this range be another accumulation opportunity--or was it setting up a reversal?  Figure 2: Look for subtle clues in consolidation ranges -- a clue like a positive stochastic divergence -- to figure out when accumulation and distribution phases end. |
| Note that both the 10- and 50-bar exponential moving averages (EMA) were moving up as the consolidation unfolded. In fact, even as the S&P 500--on the 15-minute chart--moved below the 10-bar EMA, the 50-bar EMA provided key support late on January 31. This showdown with support turned out to be the end of the accumulation phase. |
| The end of the accumulation phase, by the way, was accompanied by a positive stochastic divergence. While this sort of "clue-in" doesn't always happen, it may occur more frequently than they seem. Not only was the end of the accumulation phase on January 31 telegraphed by a positive stochastic divergence, but so was the end of the accumulation phase on the previous day, the day the rally from the low 1160s began. |
Technical Writer for Technical Analysis of STOCKS & COMMODITIES magazine, Working-Money.com, and Traders.com Advantage.
| Title: | Technical Writer |
| Company: | Technical Analysis, Inc. |
| Address: | 4757 California Avenue SW |
| Seattle, WA 98116 | |
| Phone # for sales: | 206 938 0570 |
| Fax: | 206 938 1307 |
| Website: | www.Traders.com |
| E-mail address: | DPenn@traders.com |
Traders' Resource Links | |
| Charting the Stock Market: The Wyckoff Method -- Books | |
| Working-Money.com -- Online Trading Services | |
| Traders.com Advantage -- Online Trading Services | |
| Technical Analysis of Stocks & Commodities -- Publications and Newsletters | |
| Working Money, at Working-Money.com -- Publications and Newsletters | |
| Traders.com Advantage -- Publications and Newsletters | |
| Professional Traders Starter Kit -- Software | |
Click here for more information about our publications!
Comments
Date: 02/03/05Rank: 4Comment:
Date: 02/05/05Rank: 3Comment:

Request Information From Our Sponsors
- StockCharts.com, Inc.
- Candle Patterns
- Candlestick Charting Explained
- Intermarket Technical Analysis
- John Murphy on Chart Analysis
- John Murphy's Chart Pattern Recognition
- John Murphy's Market Message
- MurphyExplainsMarketAnalysis-Intermarket Analysis
- MurphyExplainsMarketAnalysis-Visual Analysis
- StockCharts.com
- Technical Analysis of the Financial Markets
- The Visual Investor
- VectorVest, Inc.
- Executive Premier Workshop
- One-Day Options Course
- OptionsPro
- Retirement Income Workshop
- Sure-Fire Trading Systems (VectorVest, Inc.)
- Trading as a Business Workshop
- VectorVest 7 EOD
- VectorVest 7 RealTime/IntraDay
- VectorVest AutoTester
- VectorVest Educational Services
- VectorVest OnLine
- VectorVest Options Analyzer
- VectorVest ProGraphics v6.0
- VectorVest ProTrader 7
- VectorVest RealTime Derby Tool
- VectorVest Simulator
- VectorVest Variator
- VectorVest Watchdog
