HOT TOPICS LIST
- MACD
- Fibonacci
- RSI
- Gann
- ADXR
- Stochastics
- Volume
- Triangles
- Futures
- Cycles
- Volatility
- ZIGZAG
- MESA
- Retracement
- Aroon
INDICATORS LIST
LIST OF TOPICS
PRINT THIS ARTICLE
by David Penn
Almost alone among housing stocks, Temple Inland suffers its negative divergence.
Position: N/A
David Penn
Technical Writer for Technical Analysis of STOCKS & COMMODITIES magazine, Working-Money.com, and Traders.com Advantage.
PRINT THIS ARTICLE
STOCHASTICS
TIN Tumbles
02/02/05 08:25:35 AMby David Penn
Almost alone among housing stocks, Temple Inland suffers its negative divergence.
Position: N/A
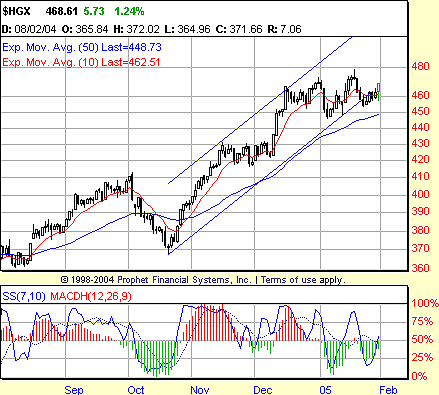
Back in early January, I suggested that a negative stochastic divergence in the homebuilding stock index ($HGX) (Figure 1) may be warning of lower prices for homebuilding stocks ("Divergences And The Housing Index," January 5, 2005). One of the things I noted was that a previous negative stochastic divergence in November 2004 led to sideways--rather than simply declining--prices. I wondered whether the more recent negative stochastic divergence in December would produce sideways or declining prices in the housing stocks. Figure 1: Homebuilding Stock Index. A negative stochastic divergence in January 2005 led to sideways trading after a sharp correction. |
| I suppose it depends on which housing stocks you're looking at. But if a generalized verdict can be rendered, then that verdict might read: Not Guilty Of A Sharp Correction. |

|
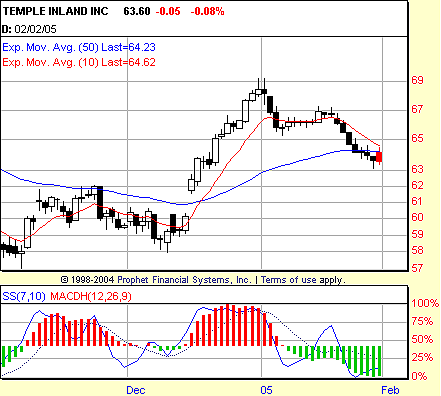
| Figure 2: Temple Inland. Support looms at the 62 level as shares of TIN slip beneath their 50-day exponential moving average. |
| Graphic provided by: Prophet Financial, Inc. |
| |
| While the housing index moved largely sideways in January, many of the housing stocks performed quite well that month. In fact, the list of advancing housing stocks in January runs like a who's who of homebuilders: Hovnanian Enterprises, KB Homes, Toll Brothers, MDC Holdings, The Ryland Group ... But there were a few homebuilders that took the news of the negative stochastic divergence quite hard indeed. One of those stocks was Champion Enterprises (CHB); another was Temple Inland (TIN). |
| Temple Inland developed a negative stochastic divergence of its own in December. This divergence came as the successively higher peaks in price over the month were matched by successively lower peaks in the 7,10 stochastic. The breakdown from this negative stochastic divergence has yet to be confirmed--which would require a drop below the 63 level. By at least one method, however, TIN was tradable to the short side by January 4-5, with only 50-odd cents worth of pain (and nearly three points of gain) as of today. |
| With TIN breaking down or swinging down through a pivot at about 65.30 (from the January 6th low), we can use Weinstein's swing rule to approximate a downside to the current move. With a previous high of 69 and a low of about 65.30, traders can expect a downside "swing" to near 61.60. A decline to this extent would likely find itself testing support between 62 and 61, support left over from the November 2004 highs. |
Technical Writer for Technical Analysis of STOCKS & COMMODITIES magazine, Working-Money.com, and Traders.com Advantage.
| Title: | Technical Writer |
| Company: | Technical Analysis, Inc. |
| Address: | 4757 California Avenue SW |
| Seattle, WA 98116 | |
| Phone # for sales: | 206 938 0570 |
| Fax: | 206 938 1307 |
| Website: | www.Traders.com |
| E-mail address: | DPenn@traders.com |
Traders' Resource Links | |
| Charting the Stock Market: The Wyckoff Method -- Books | |
| Working-Money.com -- Online Trading Services | |
| Traders.com Advantage -- Online Trading Services | |
| Technical Analysis of Stocks & Commodities -- Publications and Newsletters | |
| Working Money, at Working-Money.com -- Publications and Newsletters | |
| Traders.com Advantage -- Publications and Newsletters | |
| Professional Traders Starter Kit -- Software | |
Click here for more information about our publications!
Comments
Date: 02/05/05Rank: 3Comment:

Request Information From Our Sponsors
- StockCharts.com, Inc.
- Candle Patterns
- Candlestick Charting Explained
- Intermarket Technical Analysis
- John Murphy on Chart Analysis
- John Murphy's Chart Pattern Recognition
- John Murphy's Market Message
- MurphyExplainsMarketAnalysis-Intermarket Analysis
- MurphyExplainsMarketAnalysis-Visual Analysis
- StockCharts.com
- Technical Analysis of the Financial Markets
- The Visual Investor
- VectorVest, Inc.
- Executive Premier Workshop
- One-Day Options Course
- OptionsPro
- Retirement Income Workshop
- Sure-Fire Trading Systems (VectorVest, Inc.)
- Trading as a Business Workshop
- VectorVest 7 EOD
- VectorVest 7 RealTime/IntraDay
- VectorVest AutoTester
- VectorVest Educational Services
- VectorVest OnLine
- VectorVest Options Analyzer
- VectorVest ProGraphics v6.0
- VectorVest ProTrader 7
- VectorVest RealTime Derby Tool
- VectorVest Simulator
- VectorVest Variator
- VectorVest Watchdog
