HOT TOPICS LIST
- MACD
- Fibonacci
- RSI
- Gann
- ADXR
- Stochastics
- Volume
- Triangles
- Futures
- Cycles
- Volatility
- ZIGZAG
- MESA
- Retracement
- Aroon
INDICATORS LIST
LIST OF TOPICS
PRINT THIS ARTICLE
by Kevin Hopson
Trading sentiment could indicate a top in crude oil prices and the possibility of a pullback in the near term.
Position: N/A
Kevin Hopson
Kevin has been a technical analyst for roughly 10 years now. Previously, Kevin owned his own business and acted as a registered investment advisor, specializing in energy. He was also a freelance oil analyst for Orient Trading Co., a commodity futures trading firm in Japan. Kevin is currently a freelance writer.
PRINT THIS ARTICLE
CORRELATION ANALYSIS
Caution For Crude Oil
02/01/05 08:57:25 AMby Kevin Hopson
Trading sentiment could indicate a top in crude oil prices and the possibility of a pullback in the near term.
Position: N/A
| One thing I like to look at on a weekly basis is the "Commitments of Traders" report, which is put out every Friday by the Commodity Futures Trading Commission (CFTC). This report shows long and short positions for commercials and noncommercials as of each Tuesday. |
| Commercials are those traders who actually have a physical stake in the commodity. Because commercials conduct detailed analysis of the market, they are often considered the smart money (or a leading indicator). Noncommercials tend to be speculators. In other words, they don't have a physical stake in the commodity. As a result, they use the futures market strictly as a trading tool. Because noncommercials like to follow the momentum (trend), they tend to be a lagging or contrarian indicator. |

|
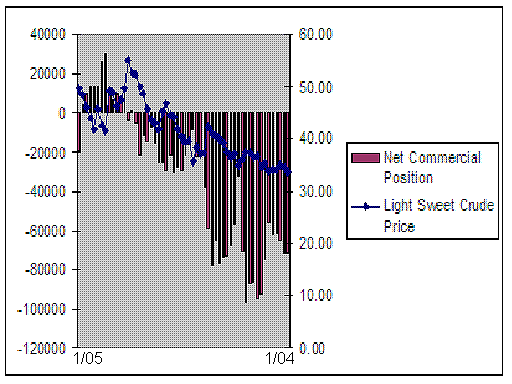
| Figure 1: One-year chart of net commercial position vs. light sweet crude price |
| Graphic provided by: Excel. |
| |
| This brings me to last week's COT report for crude oil, which shows traders' positions as of Tuesday, January 25. To summarize, noncommercials increased their net long position by nearly 18,000 contracts, while commercials reduced their net long position by nearly 23,000 contracts. In fact, commercials now have a net short position (more than 18,000 contracts) for the first time since October 26, 2004. Because commercials tend to be a leading indicator and noncommercials tend to be a contrarian indicator, last week's report indicates a significant bias toward lower prices in the near term. |
| If you look at the one-year chart, you will get a better feel for what I am talking about. Just to note, the chart is backward, meaning that you have to look at it from right (January 2004) to left (January 2005). Note how crude oil prices continued to climb last year as commercials' net short position continued to shrink. This is typical, given the correlation between the two. However, note the recent reversal in the trend, in which commercials went from a net long position of nearly 30,000 contracts to a net short position of more than 18,000 contracts. Because of this, I would be cautious on crude oil prices in the near term. |
Kevin has been a technical analyst for roughly 10 years now. Previously, Kevin owned his own business and acted as a registered investment advisor, specializing in energy. He was also a freelance oil analyst for Orient Trading Co., a commodity futures trading firm in Japan. Kevin is currently a freelance writer.
| Glen Allen, VA | |
| E-mail address: | hopson_1@yahoo.com |
Click here for more information about our publications!
Comments
Date: 02/01/05Rank: Comment: Commercials have been wrong all this while as displayed in your chart and hence I would like to call them as the contrarion indicators. When they had the highest short position OIL zoomed like anything. When they went long, it topped out. So, now that they are going short again OIL is going to have a rising bias. Good Luck and thanks.
kediasushil@gmail.com
Date: 02/02/05Rank: 4Comment:
Date: 02/05/05Rank: 4Comment:

Request Information From Our Sponsors
- StockCharts.com, Inc.
- Candle Patterns
- Candlestick Charting Explained
- Intermarket Technical Analysis
- John Murphy on Chart Analysis
- John Murphy's Chart Pattern Recognition
- John Murphy's Market Message
- MurphyExplainsMarketAnalysis-Intermarket Analysis
- MurphyExplainsMarketAnalysis-Visual Analysis
- StockCharts.com
- Technical Analysis of the Financial Markets
- The Visual Investor
- VectorVest, Inc.
- Executive Premier Workshop
- One-Day Options Course
- OptionsPro
- Retirement Income Workshop
- Sure-Fire Trading Systems (VectorVest, Inc.)
- Trading as a Business Workshop
- VectorVest 7 EOD
- VectorVest 7 RealTime/IntraDay
- VectorVest AutoTester
- VectorVest Educational Services
- VectorVest OnLine
- VectorVest Options Analyzer
- VectorVest ProGraphics v6.0
- VectorVest ProTrader 7
- VectorVest RealTime Derby Tool
- VectorVest Simulator
- VectorVest Variator
- VectorVest Watchdog
